What Is a Stress-Strain Curve? Complete Engineer’s Guide
The stress-strain curve is one of the most fundamental tools in materials engineering. It is a graphical record of how a material responds to an increasing applied load — from the very first elastic deflection all the way through plastic deformation to final fracture. Engineers use the curve to extract a complete mechanical property profile of any metal, polymer, or ceramic in a single tensile test: Young’s modulus, yield strength, ultimate tensile strength, ductility, and toughness are all readable from this one diagram. Without understanding the stress-strain curve, informed material selection, structural design, and weld procedure qualification are impossible.
This guide covers every region of the curve in detail, explains how engineering and true stress-strain values differ, walks through worked formula examples, and shows how these concepts connect directly to mechanical testing standards such as ASTM E8 and to ASME qualification requirements. Whether you are preparing for a certification exam or designing a pressure vessel, this article gives you the depth you need.
What Is Stress?
Stress is the internal resistance that a material develops in response to an externally applied force. Formally, it is the force acting perpendicular (normal) or parallel (shear) to a unit area of the material’s cross-section. Stress quantifies how hard the atoms and microstructure of a material are being pushed or pulled — it is not a directly measurable quantity, but is calculated from measured force and geometry.
The symbol for normal stress is the Greek letter sigma (σ) and for shear stress, tau (τ). The standard SI unit is the pascal (Pa), but engineering practice almost universally uses megapascals (MPa) or gigapascals (GPa) for metals, and ksi (kilopounds per square inch) in US customary units. One MPa equals one newton per square millimetre (N/mm²).
Stress is directly relevant to high-temperature pressure vessel design, weld joint qualification, and the allowable stress tables in ASME Section II Part D. Understanding stress also underpins stress corrosion cracking and sour service design.
What Is Strain?
Strain is the measure of deformation that a material undergoes in response to applied stress. It expresses how much the material’s dimensions change relative to the original dimensions, and — critically — it is dimensionless. Strain does not have units because it is a ratio of two lengths.
The symbol for normal (axial) strain is the Greek letter epsilon (ε). Shear strain uses the Greek letter gamma (γ).
Strain is directly measurable using extensometers or strain gauges clipped to the gauge length of the tensile specimen. This measured elongation data is what the testing machine plots on the x-axis of the stress-strain curve.
Stress vs. Strain — Key Differences
| Property | Stress (σ) | Strain (ε) |
|---|---|---|
| Definition | Force per unit area | Deformation relative to original dimension |
| Symbol | σ (sigma) | ε (epsilon) |
| Unit | MPa, GPa, psi, ksi | Dimensionless (mm/mm or %) |
| Measurability | Calculated (force/area) | Directly measurable with extensometer |
| Graph axis | Y-axis (vertical) | X-axis (horizontal) |
| Cause/effect | Cause (applied) | Effect (result) |
| SI base unit | Pascal (N/m²) | m/m (ratio) |
| Relevant standard | ASTM E8, ISO 6892 | ASTM E8, ISO 6892 |
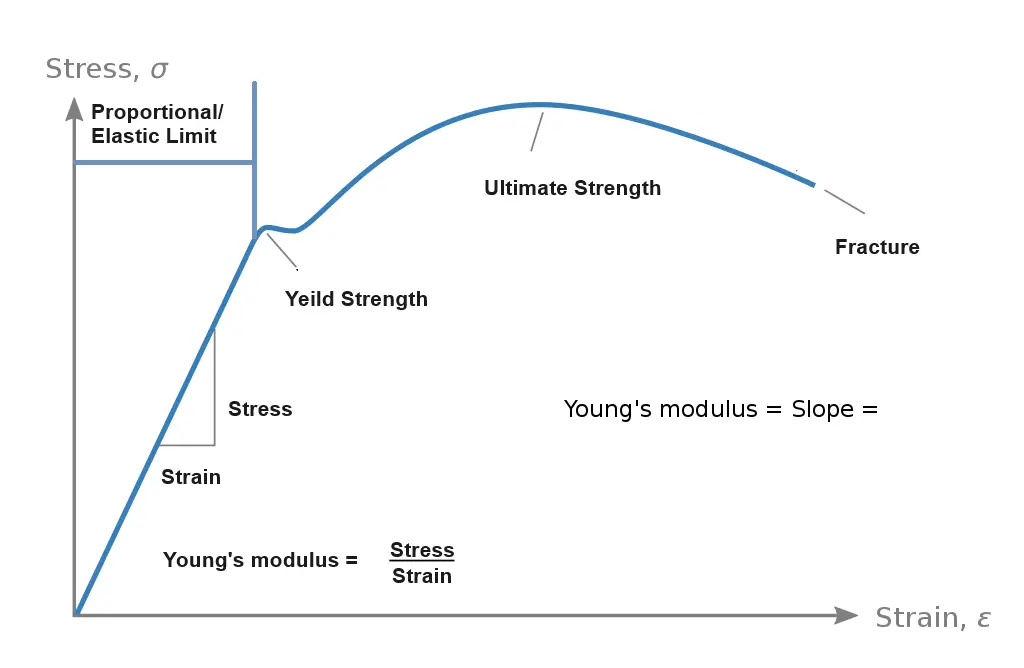
The Five Regions of the Stress-Strain Curve
Understanding each distinct region on the curve enables engineers to predict how a material will behave in service, whether it will deform elastically and spring back, yield and deform permanently, or fracture catastrophically. The following breakdown uses a ductile structural steel as the reference material.
1. Proportional Limit
The proportional limit marks the end of the perfectly linear portion of the curve. Within this region, stress and strain are directly proportional — double the stress and you double the strain. The constant of proportionality is Young’s modulus (E), which is the slope of this straight line. For structural carbon steel, E ≈ 200 GPa (29,000 ksi). All deformation within the proportional limit is fully elastic: remove the load and the material returns to exactly its original dimensions with zero permanent distortion.
2. Elastic Limit
Just above the proportional limit is the elastic limit — the highest stress at which the material still behaves elastically. Below this point, any load removed causes the specimen to recover its original shape completely. Above it, some permanent (plastic) deformation remains after unloading. In metals, the elastic limit and the proportional limit are extremely close together on the curve, making them difficult to distinguish experimentally. As a result, the elastic limit is primarily a theoretical concept used in materials education rather than a practical engineering design parameter.
3. Yield Point and Yield Strength
The yield point represents the onset of significant plastic deformation. Many engineering metals — particularly aluminium alloys and austenitic stainless steels — do not display a sharp, well-defined yield drop. For these materials, the 0.2% offset yield strength (also called the 0.2% proof strength) is used as the practical engineering definition of the yield point.
To determine the 0.2% offset yield strength: draw a line parallel to the initial elastic slope starting at a strain value of 0.002 (0.2%) on the horizontal axis. The stress at which this line intersects the actual stress-strain curve is the 0.2% yield strength. This method is standardised in ASTM E8 and ISO 6892-1 and is the value most commonly reported on material test certificates (MTCs) per the requirements of codes such as ASME Section II Part A.
4. Ultimate Tensile Strength (UTS)
The ultimate tensile strength is the maximum engineering stress value on the stress-strain curve — the peak of the curve. At this point, the specimen begins to neck: a localised reduction in cross-section forms at the weakest point of the gauge length. After necking begins, the engineering stress (calculated using the original area) appears to decrease even as the local true stress at the neck continues to rise. The UTS is the primary strength property used in structural design allowables and in weld procedure qualification tensile tests under ASME Section IX QW-150.
5. Fracture (Breaking) Point
The fracture point is where the specimen separates. In ductile metals, significant elongation and necking have occurred before fracture, and the fracture face typically shows a characteristic cup-and-cone morphology under examination. The elongation to fracture (expressed as a percentage) and the reduction in area at the fracture are both reported as measures of ductility. Brittle materials fracture close to the elastic limit with little prior plastic deformation and produce flat, granular fracture faces.
Engineering Stress and Strain vs. True Stress and Strain
Two different frameworks exist for calculating stress and strain from tensile test data. The distinction matters significantly for advanced material modelling and post-necking behaviour.
Engineering (Nominal) Stress and Strain
Engineering stress and strain use the original specimen dimensions throughout the test. They are straightforward to calculate and sufficient for most design applications within the elastic and early plastic regime. Because the original area is used, engineering stress appears to decrease after UTS due to necking, even though the material in the neck is experiencing higher and higher actual stress.
True Stress and True Strain
True stress and true strain account for the continuously changing dimensions of the specimen as it deforms. True stress is always higher than engineering stress (because the actual area is smaller than the original area). True strain accurately accumulates deformation incrementally and is additive, which engineering strain is not.
| Property | Engineering Stress/Strain | True Stress/Strain |
|---|---|---|
| Area used | Original A&sub0; (constant) | Instantaneous Ai (changing) |
| Length used | Original L&sub0; (constant) | Instantaneous Li (changing) |
| Complexity | Simple — direct from test machine | Requires area measurement or conversion |
| Post-necking accuracy | Poor | Good |
| Typical application | Design allowables, code compliance | FEA, forming simulations, advanced modelling |
| Stress magnitude vs. the other | Always lower than true stress | Always higher than engineering stress |
Ductile vs. Brittle Material Behaviour
The shape of the stress-strain curve tells you at a glance whether a material is ductile or brittle — information that is critical for selecting materials for welded structures that must absorb energy during overload conditions.
| Characteristic | Ductile Materials | Brittle Materials |
|---|---|---|
| Plastic deformation | Extensive | Negligible |
| Elongation at fracture | >5% (typically 15–40%) | <1–2% |
| Fracture face appearance | Cup-and-cone, fibrous | Flat, granular, crystalline |
| Warning before fracture | Visible necking/distortion | Sudden, no warning |
| Toughness (area under curve) | High | Low |
| Examples | Mild steel, aluminium, copper | Cast iron, ceramics, hardened steel |
| Impact test performance | Good CVN values | Low CVN values, DBTT risk |
| Design safety margin | Deformation gives warning | No visual warning; more critical |
Ductile-to-brittle transition temperature (DBTT) is a related concept critical to pressure vessel design. Body-centred cubic (BCC) metals like carbon steels become brittle at low temperatures, which is why ASME Section VIII UG-84 mandates Charpy impact testing for low-temperature service. For duplex and austenitic grades, this transition does not occur — see our guide to welding duplex stainless steels.
Mechanical Properties Derived from the Stress-Strain Curve
A single ASTM E8 tensile test produces a complete set of mechanical property data that is referenced throughout engineering codes and standards. The following table summarises the key properties, their definitions, and their code significance.
| Property | Symbol | Definition / How Obtained | Typical Carbon Steel Value | Code Reference |
|---|---|---|---|---|
| Young’s Modulus (Elasticity) | E | Slope of linear elastic region | 200 GPa | ASME II-D Table TM |
| 0.2% Offset Yield Strength | Rp0.2 or Sy | 0.2% offset intersection | 250–400 MPa | ASME II-D Table Y-1 |
| Ultimate Tensile Strength | UTS or Rm | Peak engineering stress | 400–550 MPa | ASME IX QW-150 |
| Elongation at Fracture | A% | % increase in gauge length | 20–30% | Material specification |
| Reduction in Area | Z% | % decrease in cross-sectional area at fracture | 50–70% | Material specification |
| Modulus of Resilience | Ur | Area under elastic region | 0.31 MJ/m³ (typical) | Spring/elastic design |
| Modulus of Toughness | Ut | Total area under curve to fracture | Variable by grade | Impact-resistant design |
| Poisson's Ratio | ν | Lateral to axial strain ratio (elastic region) | 0.27–0.30 | FEA, thermal analysis |
How a Stress-Strain Curve Is Generated: ASTM E8 Tensile Test
The stress-strain curve is not estimated or assumed — it is generated experimentally using a universal testing machine (UTM) following a standardised procedure. For metallic materials, ASTM E8/E8M is the definitive standard in North America; ISO 6892-1 is the international counterpart. Both govern specimen geometry, test speed, extensometer requirements, and the calculation of reported properties.
Test Procedure Step by Step
- Specimen preparation: Machine or stamp a test coupon to the dimensions specified in ASTM E8. Round specimens typically have a 12.5 mm (0.5 in.) diameter gauge section; flat specimens are cut from plate or sheet. Measure and record the gauge length (typically 50 mm / 2 in.) and cross-sectional area precisely.
- Grip mounting: Mount the specimen in self-aligning grips to minimise bending. Misalignment introduces bending stress that distorts the measured elastic modulus and yield values.
- Extensometer attachment: Attach a calibrated extensometer to the gauge length. This instrument measures elongation directly and with far greater accuracy than crosshead displacement, which includes machine compliance and grip slip.
- Load application: Apply tensile force at a controlled constant strain rate or stress rate per ASTM E8 requirements. Too fast a rate produces artificially elevated yield and tensile values.
- Data acquisition: The load cell records force (N) and the extensometer records displacement (mm) at high frequency. The software converts these to engineering stress and strain and plots the curve in real time.
- Post-fracture measurements: Remove the fractured halves, fit them together, and measure final gauge length and minimum cross-section diameter to calculate elongation and reduction in area.
The tensile test described above is closely related to other mechanical testing procedures used in weld qualification, including bend tests, hardness surveys, and Charpy impact tests. Together, these tests confirm that the welded joint meets the mechanical property requirements of the applicable fabrication code.
Worked Numerical Example: Reading a Stress-Strain Curve
The following worked example shows how to extract and calculate key mechanical properties from test machine data, as would be done when reviewing a weld procedure qualification tensile report.
Connection to Welding and Fabrication Codes
The stress-strain curve and the properties derived from it are not merely academic. They drive the allowable stress values, qualification test acceptance criteria, and design decisions throughout pressure vessel, piping, and structural fabrication codes.
- ASME Section II Part D: Tabulates allowable stress (S) values for all ASME-recognised materials at temperatures from ambient to 800°C+. These S values are derived as fractions of yield strength and UTS from tensile testing.
- ASME Section IX QW-150: Requires tension tests on procedure qualification test coupons. The broken specimen must meet or exceed the minimum specified UTS of the base metal.
- ASME Section VIII UG-84: References impact test requirements that are triggered by material yield strength and service temperature — directly linking the stress-strain curve to fracture toughness requirements.
- AWS D1.1: Structural welding code tensile test acceptance criteria reference the same ASTM E8-generated UTS values.
Understanding how the stress-strain curve of your base metal, weld metal, and heat-affected zone interact is fundamental to predicting joint behaviour. See our detailed guide on delta ferrite in stainless steel welding and the carbon equivalent calculator to understand how alloy chemistry affects these mechanical properties.
Recommended Books on Materials Testing and Metallurgy
Disclosure: WeldFabWorld participates in the Amazon Associates programme (StoreID: neha0fe8-21). If you purchase through these links, we may earn a small commission at no extra cost to you. This helps support free technical content on this site.
Frequently Asked Questions
What are the five key regions of a stress-strain curve?
The five key regions are: (1) the proportional limit, where stress and strain are linearly related and Young’s modulus is constant; (2) the elastic limit, the boundary of fully reversible deformation; (3) the yield point (0.2% offset), where permanent plastic deformation begins; (4) the ultimate tensile strength, the peak stress the material can sustain; and (5) the fracture or breaking point, where the specimen separates.
Ductile materials show all five stages clearly, while brittle materials fracture near the elastic limit with little plastic deformation and an almost linear curve to failure. Understanding each region is essential for interpreting mechanical test reports and design allowables.
What is the difference between engineering stress and true stress?
Engineering stress divides the applied force by the original cross-sectional area (constant throughout the test), making it easy to measure but inaccurate once significant necking occurs. True stress divides the instantaneous force by the instantaneous area, giving a more accurate picture of the actual stress state inside the material.
True stress is always higher than engineering stress after the onset of necking. Similarly, engineering strain uses the change in length over the original gauge length, while true strain is the natural logarithm of the instantaneous-to-original length ratio. For standard design work, engineering values are used; for finite element analysis and forming simulations, true stress-strain data is required.
How is the 0.2% offset yield strength determined?
Because many metals — particularly aluminium alloys and austenitic stainless steels — do not have a sharp, well-defined yield drop, the 0.2% offset method is used as the engineering standard. A line is drawn parallel to the initial linear (elastic) portion of the stress-strain curve, starting at a strain value of 0.002 (0.2%) on the horizontal axis.
The stress at which this offset line intersects the actual stress-strain curve is defined as the 0.2% proof strength or offset yield strength. This method is standardised in ASTM E8 and ISO 6892-1 and is the value most commonly reported on material test certificates under codes such as ASME Section II Part A.
What is Young’s modulus and how is it read from the stress-strain curve?
Young’s modulus (E) is the slope of the linear elastic portion of the stress-strain curve: E = σ / ε. It represents the material’s stiffness — its resistance to elastic deformation under load. For structural steel, E is approximately 200 GPa (29,000 ksi). Aluminium alloys have E ≈ 70 GPa, and titanium alloys fall around 115 GPa.
The modulus is obtained by selecting two points within the linear elastic region of the curve and calculating the rise (stress difference in MPa) divided by the run (strain difference, dimensionless). Once the proportional limit is exceeded, the curve is no longer linear and Young’s modulus no longer describes the material behaviour accurately. ASME Section II Part D Table TM lists temperature-dependent modulus values for all code-recognised materials.
Why do ductile and brittle materials have different stress-strain curve shapes?
Ductile materials (mild steel, aluminium, copper) can sustain substantial plastic deformation before fracture because their crystal structures allow dislocations to move and accommodate strain. This produces a stress-strain curve with a clearly defined yield point, a long plastic deformation region, a peak at UTS from necking, and a descending engineering stress before final fracture.
Brittle materials (cast iron, ceramics, hardened tool steel) have limited dislocation mobility. Cracks initiate and propagate rapidly at stress concentrations before plastic flow can redistribute the load. Their stress-strain curves are nearly straight lines ending in abrupt fracture near the elastic limit. Brittle materials can actually have very high UTS but extremely low toughness (small area under the curve), making them unsuitable for impact or dynamic loading applications.
Which ASTM standard governs tensile testing of metals?
ASTM E8/E8M is the primary standard for tensile testing of metallic materials. It specifies specimen geometry (flat, round, sheet, plate, wire), gauge length requirements, grip design, test speed, and methods for determining yield strength, tensile strength, elongation, and reduction in area. For plastic materials, ASTM D638 applies. ISO 6892-1 is the international equivalent for metals and is substantially harmonised with ASTM E8.
Many ASME fabrication codes — including Section VIII, Section IX, and Section II Parts A, B, and C — reference mechanical properties obtained in accordance with ASTM E8. The ASME Section IX qualification reduced-section tensile test acceptance criteria are based on the minimum specified UTS from the applicable material specification, which in turn derives from ASTM E8 testing of production heats.
What does the area under the stress-strain curve represent?
The total area under the stress-strain curve up to fracture represents the modulus of toughness — the energy absorbed per unit volume of material before fracture, expressed in MJ/m³ or in-lbf/in³. A large area indicates a tough material that can absorb significant impact or shock loading without breaking. This is why ductile materials are preferred for pressure vessels and structural components subject to dynamic loading.
The area under only the elastic portion of the curve is the modulus of resilience — the elastic energy the material can store and fully recover. Spring materials are selected for high resilience (high yield strength and moderate modulus). Toughness is critical in seismic, blast-resistant, and cryogenic applications. The Charpy impact test provides a rapid, qualitative measure of toughness, which is why it is mandated by ASME UG-84 for vessels in low-temperature service.
How does the stress-strain curve relate to weld qualification and ASME codes?
ASME Section IX and Section VIII rely on tensile test results derived from stress-strain data to qualify weld procedures and assess welder performance. Tensile specimens cut from procedure qualification test coupons per QW-150 must meet the minimum UTS requirements for the base metal classification. If the specimen breaks in the base metal above the minimum, the test passes regardless of the exact fracture load.
ASME Section II Part D tabulates allowable stresses at various temperatures derived from UTS and yield strength data obtained through ASTM E8 testing. These S values ensure that design stresses remain below yield under normal operating conditions and provide an adequate safety margin against UTS. Changes to material heat treatment or composition that shift the stress-strain curve can trigger re-qualification — particularly relevant for P91 creep-resistant steels where the yield-to-UTS ratio is tightly controlled.