Six Sigma in Welding & Fabrication: DMAIC, Tools & Practical Examples
Six Sigma is a disciplined, data-driven methodology for eliminating defects and reducing process variation, and in the welding and fabrication industry it is one of the most powerful quality improvement frameworks available. Every rejected weld, every rework cycle, and every non-conformance report represents a cost — in material, labour, schedule, and reputation. Six Sigma provides the structured toolset to trace those failures back to their statistical root causes and eliminate them permanently, rather than relying on end-of-line inspection to catch problems after the damage is done.
Originally developed at Motorola in the mid-1980s and later embedded across General Electric’s global operations in the 1990s, Six Sigma has since proven its value far beyond manufacturing. Today its principles are applied in pressure vessel fabrication shops, structural steel yards, oil and gas construction projects, and piping spool shops worldwide. This guide explains what Six Sigma is, how its DPMO metric and Sigma level system work, how to apply the DMAIC framework to real weld quality problems, and which tools from the Six Sigma toolkit are most directly useful in a fabrication context.
What Is Six Sigma?
Six Sigma is a systematic methodology for reducing process variation and eliminating defects by applying statistical analysis to identify and remove the root causes of non-conformances. The term “Sigma” (σ) is the standard statistical symbol for standard deviation — a measure of how much a set of values spreads around its mean. The “Six” refers to six standard deviations between the process mean and the nearest specification limit, which corresponds to a defect rate of just 3.4 defects per million opportunities (DPMO).
The methodology rests on five core principles that apply equally to a manufacturing plant, a weld fabrication shop, or an engineering project office:
| Principle | What It Means in Practice |
|---|---|
| Customer Focus | Every improvement project is driven by a clear understanding of what the customer (internal or external) requires — e.g., a weld repair rate below 1%, or dimensional tolerance within ±1 mm. |
| Statistical Decision-Making | Problems are defined by data, not opinion. Weld defect frequencies, heat input distributions, and dimensional scatter are measured and analysed statistically before any solution is proposed. |
| Process Orientation | The focus is on the process that produces a result, not the inspection that reveals it. Improving the welding process is more sustainable than increasing inspection frequency. |
| Proactive Management | Risk is anticipated and controlled using tools like FMEA before failures occur, rather than reacting to them. |
| Collaboration | Successful projects draw on cross-functional teams — welders, QC engineers, procurement, and production supervisors all contribute their domain knowledge. |
DPMO and Sigma Levels Explained
The DPMO metric is central to Six Sigma. It normalises defect rates across processes with different numbers of opportunities for failure, making it possible to compare quality performance fairly between a simple fillet weld and a complex multi-pass buttweld with 10 inspection criteria.
DPMO = (Number of Defects / (Units × Opportunities per Unit)) × 1,000,000
Worked Example:
A piping fabrication shop completes 400 weld joints in a month.
Each joint is checked against 5 quality criteria (visual, dimensional, RT, hardness, PWHT record).
During the month, 30 non-conformances are raised across all criteria.
DPMO = (30 / (400 × 5)) × 1,000,000
DPMO = (30 / 2,000) × 1,000,000
DPMO = 15,000 → approximately 3.7 Sigma level
Each Sigma level corresponds to a specific DPMO and yield percentage. The table below shows the full scale from 1σ to 6σ:
| Sigma Level | DPMO | Yield (%) | Typical Process Description |
|---|---|---|---|
| 1 σ | 691,462 | 30.9% | Chaotic, uncontrolled process |
| 2 σ | 308,538 | 69.1% | Poor — significant rework common |
| 3 σ | 66,807 | 93.3% | Average manufacturing performance |
| 4 σ | 6,210 | 99.38% | Good — most commercial fabrication targets |
| 5 σ | 233 | 99.977% | Very high capability |
| 6 σ | 3.4 | 99.9997% | Near-perfect — aerospace and nuclear benchmark |
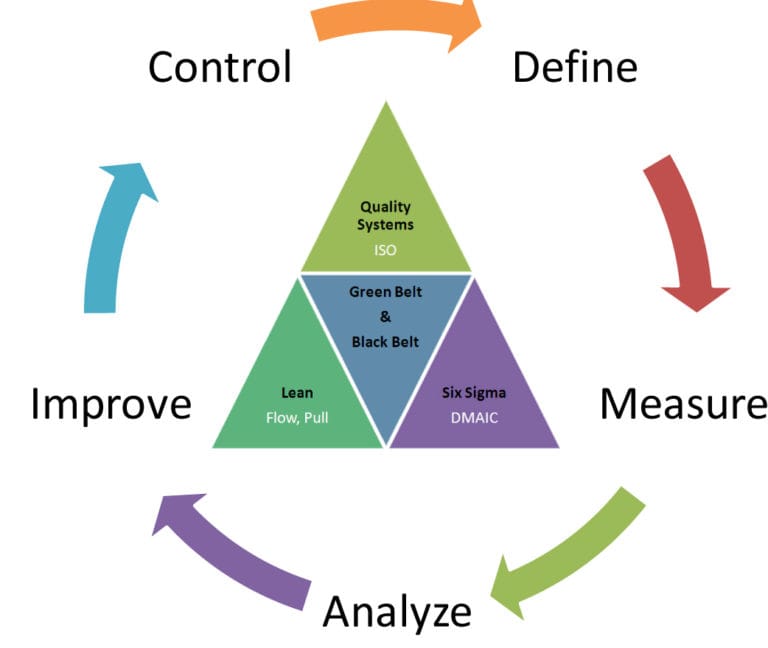
The DMAIC Framework in Fabrication
DMAIC — Define, Measure, Analyze, Improve, Control — is the structured problem-solving roadmap at the heart of Six Sigma. Unlike ad hoc troubleshooting, DMAIC forces teams to verify that a problem is real (with data), identify its true root cause (not a symptom), test solutions before full deployment, and put controls in place that prevent regression. Below is how each phase applies to a typical welding or fabrication quality problem.
Phase 1 — Define
The Define phase scopes the project and ensures the team is solving the right problem. Key deliverables include a Project Charter, a SIPOC (Suppliers-Inputs-Process-Outputs-Customers) map, and a clear problem statement tied to a measurable business impact.
Phase 2 — Measure
The Measure phase establishes a reliable data baseline. The team identifies all measurable variables (the Xs) that may influence the output quality (the Y), then collects sufficient data to calculate the current DPMO and process capability (Cp/Cpk). A measurement system analysis (MSA) or gauge R&R study is often conducted here to confirm that the inspection method itself is consistent and reliable.
Key Metrics in a Weld Quality Measure Phase
- Repair rate (%) by weld joint type, position, and welder ID
- Defect type frequency (porosity, LOF, undercut, cracks)
- DPMO calculated from RT/UT film review records
- Process parameters: heat input (kJ/mm), interpass temperature, shielding gas flow rate
- Current Cp/Cpk for critical dimensions (fit-up gap, bevel angle, reinforcement)
Phase 3 — Analyze
The Analyze phase uses statistical tools to move from correlation to cause. A fishbone (Ishikawa) diagram maps all potential causes under the categories of Man, Machine, Material, Method, Measurement, and Environment. Pareto charts then rank which causes account for the greatest share of defects. Regression analysis and hypothesis testing confirm which variables have a statistically significant relationship with the defect rate.
Phase 4 — Improve
The Improve phase designs, tests, and validates solutions. Design of Experiments (DOE) is often used here to run controlled trials varying multiple parameters simultaneously — for example, testing different shielding gas mixes, travel speeds, and interpass temperatures to find the combination that minimises porosity probability. Pilot weld runs under the improved parameters are assessed by RT before the solution is approved for full production.
Phase 5 — Control
The Control phase institutionalises the improvement. A control plan is written specifying which parameters must be monitored, how often, and by whom. Statistical Process Control (SPC) charts — particularly X-bar and R control charts for continuous variables like heat input — are deployed on the shop floor or in the QC monitoring system. An updated WPS (Welding Procedure Specification) incorporates the improved parameters, and the welder qualification matrix is updated accordingly.
Key Six Sigma Tools for Welding & Fabrication
Six Sigma draws on a large toolkit. The tools described below are those most directly applicable to weld quality improvement projects. A Green Belt or Black Belt working in a fabrication environment will use these regularly.
Pareto Chart
A Pareto chart ranks defect types or problem sources by frequency, applying the 80/20 rule: typically 80% of the defects come from 20% of the causes. In a fabrication shop, a Pareto chart built from three months of RT film records might reveal that porosity accounts for 55% of all rejections, LOF for 28%, and undercut for 12% — immediately directing the team to focus their DMAIC project on porosity first.
Fishbone (Ishikawa) Diagram
The fishbone diagram maps all potential causes of a defect under six standard categories: Man (welder skill, training, fatigue), Machine (power source stability, wire feeder consistency), Material (electrode moisture, base metal chemistry, shielding gas purity), Method (WPS parameters, preheat control, interpass temperature), Measurement (RT technique, gauge calibration), and Environment (draughts, humidity, temperature). This structured brainstorming prevents teams from jumping to conclusions and ensures all cause categories are explored.
Control Charts (SPC)
Statistical Process Control charts monitor process variables over time, distinguishing normal random variation (common cause) from abnormal spikes caused by specific events (special cause). In welding, X-bar and R charts are applied to parameters such as heat input (kJ/mm), arc voltage, wire feed speed, and interpass temperature. When a data point exceeds the control limits, the chart triggers an investigation — before a defect reaches the inspector.
Process Capability (Cp and Cpk)
Cp and Cpk indices quantify how well a process fits within its specification limits. Cp measures potential capability (assuming perfect centering); Cpk adjusts for the actual process mean position. Most quality management systems require a minimum Cpk of 1.33 for critical dimensions, which corresponds to a 4σ process.
Cp = (USL − LSL) / (6 × σ) ← Potential capability (centred process)
Cpk = min [ (USL − μ) / (3 × σ), (μ − LSL) / (3 × σ) ] ← Actual capability (accounts for centering)
Interpretation:
Cpk < 1.00 → Process is NOT capable; defects are being produced
Cpk 1.00–1.33 → Marginally capable; tighten controls
Cpk ≥ 1.33 → Capable at 4σ — minimum target for fabrication
Cpk ≥ 1.67 → 5σ capability — target for safety-critical welds
Failure Mode and Effects Analysis (FMEA)
FMEA is a proactive risk assessment tool. For each step in the welding process, the team identifies potential failure modes (e.g., “shielding gas flow drops due to regulator freeze”), estimates the Severity (S), Occurrence probability (O), and Detectability (D) on a 1–10 scale, and calculates a Risk Priority Number (RPN = S × O × D). High-RPN failure modes are targeted for preventive action before they cause production defects.
FMEA is especially valuable in fabrication during the qualification of new welding procedures or when introducing a new base material — exactly the situation where a careful pre-production risk assessment can prevent costly rework on the first production welds. It integrates naturally with the P91 steel welding requirements and other challenging material specifications.
Root Cause Analysis (RCA)
RCA tools such as the 5-Why technique drill down from the symptom to the true root cause. For example: Why did the weld have porosity? → The shielding gas flow was insufficient. Why? → The flow meter reading was incorrect. Why? → The flow meter was not calibrated. Why? → There is no calibration schedule for flow meters. Why? → Flow meters were not included in the inspection equipment register. Root cause: absence of a flow meter in the calibration programme. The corrective action targets the root cause, not just the symptom.
Six Sigma Belt Roles and Responsibilities
Six Sigma deployment follows a structured hierarchy of trained practitioners. Each belt level corresponds to a defined scope of responsibilities and statistical competency:
| Belt Level | Certification Focus | Typical Role in Fabrication | Key Competencies |
|---|---|---|---|
| Yellow Belt | Awareness & participation | Welder, inspector, technician | DMAIC overview, data collection, basic Pareto |
| Green Belt | Project leadership (part-time) | QC engineer, supervisor | SPC, Cp/Cpk, fishbone, FMEA, basic DOE |
| Black Belt | Full-time project leadership | QA manager, process engineer | Advanced statistics, DOE, regression, ANOVA |
| Master Black Belt | Strategic programme direction | Quality director, programme lead | Deployment strategy, training design, mentoring |
| Champion | Executive sponsorship | Plant manager, VP Quality | Resource allocation, organisational alignment |
Applying Six Sigma in Welding & Fabrication: Practical Examples
The following examples illustrate how DMAIC and its tools are applied to real quality problems encountered in fabrication shops and construction sites.
Example 1 — Reducing Porosity in GTAW Root Passes on Stainless Steel
A pressure vessel fabrication shop was experiencing a 9% porosity rejection rate on GTAW root pass welds on 304L stainless steel nozzles, against an ASME Section VIII acceptance criterion target of below 2%. A DMAIC project was initiated.
In the Define phase, the problem was scoped to root passes only (not fill and cap) and a project charter was issued. In the Measure phase, RT records from the previous three months were analysed, yielding a DPMO of 90,000 — a 2.8σ process. In the Analyze phase, a fishbone diagram identified 12 potential causes. A cause-and-effect matrix and scatter plots identified shielding gas back-purge flow rate and back-purge oxygen content as the two strongest correlates with porosity frequency. In the Improve phase, a DOE ran three back-purge flow settings and two purging duration times, measuring oxygen content with a portable analyser. The optimal combination achieved consistent O<50ppm before welding, dropping the porosity rate to 1.3%. In the Control phase, a back-purge checklist was added to the pre-weld inspection record, and an oxygen analyser was purchased and included in the inspection equipment calibration register. You can read more about GTAW process controls on WeldFabWorld.
Example 2 — Improving Dimensional Conformance on Pipe Spool Fit-Up
A piping spool contractor recorded 18% of spools requiring dimensional rework before the final fit-up check, primarily driven by out-of-tolerance face-to-face dimensions. A Green Belt project applied DMAIC to the cutting, fit-up, and tacking process steps. Measurement system analysis revealed that the measuring tape method used by fitters had a gauge R&R of 28% — meaning the measurement method itself contributed significantly to apparent variation. Replacing tape measures with digital vernier calipers for critical face-to-face dimensions reduced the measurement error to under 5%. Further analysis showed that tack weld shrinkage was being ignored when cutting to length. Implementing a consistent 1.5mm addition per tack joint in the cut length calculation reduced the rework rate to 4.5%.
For fabrication dimensional calculations, our Pipe Weight Calculator and Elbow Weight Calculator can support accurate material planning.
Example 3 — Reducing Weld Consumable Consumption Waste
A structural steel fabricator found that actual consumable consumption was running 35% over the estimated consumption per joint, inflating project costs significantly. A Yellow-Belt-led data collection exercise using the principles of Six Sigma waste analysis identified three main drivers: excessive weave bead width beyond WPS limits (driven by welder preference rather than engineering requirement), inconsistent joint preparation angles resulting in larger groove volumes than designed, and over-deposition of cap pass reinforcement. Addressing these through revised welder briefings, bevel angle go/no-go gauges, and reinforcement height measurement at weld completion reduced over-consumption to 11%. The V-Groove Consumable Calculator and Fillet Consumable Calculator are useful for establishing accurate baseline consumption estimates.
Six Sigma vs Lean: Understanding the Difference
Six Sigma and Lean are often mentioned together, but they address different types of problems. Understanding the distinction helps you choose the right approach for the situation at hand.
| Dimension | Six Sigma | Lean | Lean Six Sigma |
|---|---|---|---|
| Primary Focus | Reducing defects & variation | Eliminating waste & improving flow | Both simultaneously |
| Core Question | Why does the process produce defects? | Where is time & effort wasted? | How do we make the process fast AND defect-free? |
| Key Methodology | DMAIC | Value Stream Mapping, 5S, Kaizen | DMAIC with Lean waste analysis integrated |
| Measurement | DPMO, Sigma level, Cp/Cpk | Cycle time, OEE, lead time | Both sets of metrics |
| Welding Example | Reduce porosity rate in root passes | Reduce time between fit-up and welding start | Reduce both rework and waiting time simultaneously |
| Best Used When | Quality defects are the dominant cost driver | Delay, handling, and motion are the dominant wastes | Complex problems with both quality and flow issues |
Industries and Applications Beyond the Fabrication Shop
While the focus of this guide is welding and fabrication, it is worth noting that Six Sigma’s principles are directly transferable to all engineering disciplines. In the oil and gas sector, it is applied to pipeline integrity management, valve inspection programmes, and construction quality systems. In the nuclear and pressure equipment sectors — where codes such as ASME Section IX govern weld procedure qualification — Six Sigma provides the quantitative framework to demonstrate and sustain the process capability that those codes implicitly demand. For more on ASME weld qualification standards, see the ASME Section IX practice quiz on WeldFabWorld.
In NDT and inspection departments, Six Sigma has been used to reduce radiograph retake rates, standardise UT probe performance monitoring, and improve the turnaround time for inspection documentation. All of these processes have measurable outputs and identifiable causes of variation — exactly the conditions Six Sigma is designed for. The principles also apply when reviewing mechanical testing data or conducting corrosion assessment programmes.
Six Sigma Certification: What to Expect
Six Sigma certifications are offered by numerous accredited bodies including ASQ (American Society for Quality), IASSC (International Association for Six Sigma Certification), and various university and professional training organisations. There is no single universally mandated standard body, so it is worth verifying that a chosen certification is recognised by the industries or employers you work with.
| Certification Level | Typical Duration | Prerequisites | Recommended For |
|---|---|---|---|
| Yellow Belt | 1–3 days | None | All shop floor and inspection staff |
| Green Belt | 2–6 weeks | Yellow Belt or equivalent experience | QC engineers, supervisors |
| Black Belt | 3–6 months | Green Belt + completed projects | QA managers, senior engineers |
| Master Black Belt | 6–12 months | Black Belt + significant project portfolio | Quality directors, programme leads |
For professionals in welding and fabrication, a Green Belt certification paired with strong quality management certification knowledge is a highly marketable combination that opens roles in QA management, project quality control, and quality systems consultancy.
The Future of Six Sigma: Digital Tools and AI Integration
Six Sigma is evolving with advances in Industry 4.0, IIoT (Industrial Internet of Things), and artificial intelligence. In modern fabrication facilities, real-time welding parameter monitoring systems continuously log arc voltage, wire feed speed, travel speed, and shielding gas flow for every weld bead. This creates a data-rich environment where SPC control charts can be generated automatically, out-of-control conditions trigger immediate alerts, and trend analysis can predict process drift before defects occur.
Machine learning models trained on historical weld quality data are beginning to correlate real-time parameter deviations with defect probability, allowing proactive intervention during welding rather than reactive rejection during inspection. While these tools augment Six Sigma, they do not replace it — the structured problem-solving logic of DMAIC, the discipline of hypothesis testing, and the organisational change management principles of Six Sigma remain essential for interpreting and acting on the data these systems generate.
Recommended Reading
Disclosure: WeldFabWorld participates in the Amazon Associates programme (StoreID: neha0fe8-21). If you purchase through these links, we may earn a small commission at no extra cost to you. This helps support free technical content on this site.