Fractography in Metals: A Professional Guide to Fracture Surface Analysis
Fractography is the systematic study of fracture surfaces in metals and other engineering materials to determine the mechanism, origin, and root cause of failure. By examining the topography of a broken component — whether with the naked eye, a stereo microscope, or a high-resolution Scanning Electron Microscope (SEM) — engineers can read a fracture surface as a record of every stage in the failure event, from the initial crack nucleation site through propagation to final overload. This makes fractography one of the most powerful and direct tools available in engineering failure analysis and forensic metallurgy.
Every pressure vessel, structural weld, rotating shaft, and safety-critical component that fractures leaves behind physical evidence embedded in its fracture surface. The unique surface texture, pattern of crack front marks, and microscale morphology of that surface together tell the complete story of the failure: was it fatigue, overload, brittle fracture, stress corrosion, or some combination? Understanding how to read that evidence — and how it connects to material properties, design decisions, and operating environment — is a core competency for welding engineers, CWI inspectors, and materials specialists working in pressure equipment, oil and gas, and heavy fabrication.
This guide covers the fundamentals of fractographic analysis, the principal fracture modes encountered in metallic components, interpretation techniques at both macro and micro scales, and the practical application of fractography in shaft failure analysis and welded fabrications. Where relevant, connections to mechanical testing standards and ASME code requirements are noted throughout.

What is Fractography? Scope and Purpose
The term fractography was coined to describe the descriptive study of fractures, distinct from the more theoretical field of fracture mechanics. While fracture mechanics models crack growth using stress intensity factors and material toughness values, fractography provides the physical observation and interpretation of actual fracture surfaces produced in service or in laboratory testing. The two disciplines are complementary: fractographic observations provide the evidence that feeds into fracture mechanics analysis, and fracture mechanics predictions help explain what the fractographic features mean in terms of stress state and crack history.
In engineering practice, fractography is central to the failure analysis workflow. A systematic failure analysis investigation typically proceeds as follows:
- Preserve and document the fracture surface (photography, dimensional measurements)
- Conduct macro-fractographic examination — naked eye, hand lens, stereo microscope
- Identify fracture mode, origin location, and propagation direction
- Conduct micro-fractographic examination — SEM at appropriate magnifications
- Collect EDS/EDX data for elemental analysis of fracture deposits if needed
- Correlate fractographic findings with metallographic cross-sections and hardness data
- Integrate with load history, service environment, and design data to determine root cause
Importance of Fractography in Metallurgy and Failure Analysis
Fractographic examination is not merely an academic exercise. In engineering practice it directly informs corrective actions, design improvements, and fitness-for-service assessments. The principal reasons to conduct fractography include:
- Root cause identification: Distinguishing fatigue from overload, brittle fracture, or stress corrosion cracking changes the entire corrective action plan.
- Origin location: Identifying where a crack started — at a surface defect, a weld toe, a geometric notch, or an internal inclusion — directs attention to the specific process or design feature that requires correction.
- Load history reconstruction: Beach mark spacing and striation counts can in some cases provide quantitative estimates of crack growth rate and cycles to failure.
- Environmental context: Corrosion products, oxide layers, and contaminant deposits on fracture surfaces reveal whether the operating environment contributed to failure, guiding decisions on material upgrade or protective measures.
- Manufacturing quality: Internal defects such as porosity, lack of fusion, or laminations visible on fracture surfaces indicate fabrication or welding quality issues.
- Litigation and insurance: Fractographic evidence provides objective, physical documentation in failure disputes, and is often central to insurance claims and legal proceedings.
Principal Fracture Modes in Metals
Before interpreting a fracture surface, the analyst must understand the fundamental modes by which metals fracture. Each mode produces characteristic macroscopic and microscopic surface features.
Ductile Fracture
Ductile fracture occurs when the material undergoes significant plastic deformation before and during fracture. Macroscopically it is characterised by necking (in tensile specimens), a dull grey or silky fibrous appearance, and a shear lip at 45 degrees to the applied tensile axis. In pressure vessel steels and weld metals, ductile fracture is the desired mode since it provides warning (visible deformation) before catastrophic failure.
Under SEM, ductile fracture surfaces show dimple rupture morphology: a field of cup-like microvoids that nucleated at inclusions, second-phase particles, or grain boundary precipitates and then grew and coalesced until the remaining ligament failed. Equiaxed dimples indicate pure tension; elongated parabolic dimples indicate shear loading; and asymmetric dimples indicate tearing mode. The size and depth of dimples correlate with inclusion spacing and material cleanliness — steels with lower inclusion density produce larger, fewer dimples and exhibit higher fracture toughness.
Brittle Fracture
Brittle fracture involves little to no plastic deformation before failure. The fracture surface is bright and crystalline, often with a distinctive chevron or herringbone pattern pointing back to the origin. Two primary microscale mechanisms produce brittle fracture surfaces:
- Transgranular cleavage: The crack propagates across grains along specific low-energy crystallographic planes, producing flat, river-marked facets. River marks converge upstream toward the crack origin. Cleavage is promoted by low temperature, high strain rate, large grain size, and hydrogen embrittlement.
- Intergranular fracture: The crack propagates along grain boundaries, producing a faceted surface with clearly visible grain faces. Intergranular fracture is typically caused by grain boundary embrittlement from hydrogen, temper embrittlement, liquid metal embrittlement, or grain boundary precipitates such as carbides in sensitised stainless steel. See the WeldFabWorld guide on stainless steel weld decay for more on sensitisation-related embrittlement.
Fatigue Fracture
Fatigue fracture results from cyclic loading at stress levels often well below the material’s ultimate tensile strength. It is the most commonly encountered fracture mode in rotating machinery, pressure cycling equipment, and structural components subject to vibration. Fatigue fractures progress through three stages: initiation (Stage I), stable crack propagation (Stage II), and final overload (Stage III).
Key macroscopic features of fatigue fractures include beach marks (clamshell marks), a smooth, often discoloured fatigue zone, and a rough overload zone. The relative size of the fatigue zone compared to the total cross-section gives information about the applied stress level: a large fatigue zone relative to cross-section indicates low applied stress; a small fatigue zone indicates high applied stress.
Stress Corrosion Cracking (SCC) and Corrosion Fatigue
Stress corrosion cracking and corrosion fatigue produce fracture surfaces that combine mechanical and environmental features. SCC surfaces often show branched cracking, intergranular paths in susceptible alloys, and distinctive corrosion product staining. Corrosion fatigue surfaces resemble normal fatigue but with corrosion staining, often multiple initiation sites (due to pitting), and accelerated crack growth rates. See the WeldFabWorld guide on sour service and types of corrosion for the broader metallurgical context.
Fracture Mode Comparison Table
| Feature | Ductile Overload | Brittle Cleavage | Fatigue | SCC / Corrosion Fatigue |
|---|---|---|---|---|
| Macro appearance | Dull, fibrous, grey; shear lip | Bright, crystalline; chevrons | Smooth zone + rough overload | Stained, branched cracks |
| Deformation | Significant necking | Negligible | Minimal until overload | Minimal |
| SEM morphology | Dimple rupture (equiaxed / parabolic) | Cleavage facets + river marks | Striations; dimples in overload | Mixed intergranular + cleavage |
| Crack path | Transgranular | Transgranular or intergranular | Transgranular Stage II | Intergranular or transgranular |
| Loading type | Monotonic overload | Rapid impact or low temperature | Cyclic, below yield | Sustained or cyclic + environment |
| Mode indicator | Safe failure | Catastrophic risk | Most common | Environment-driven |
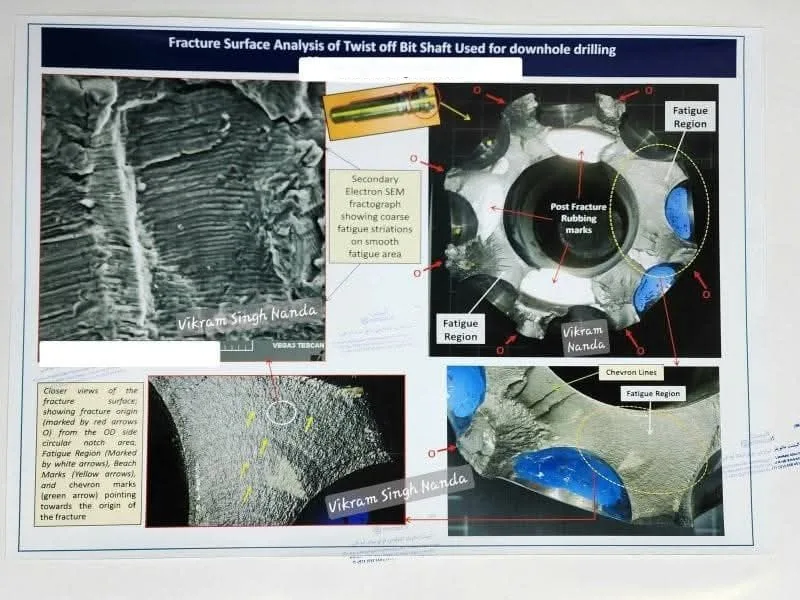
Fractography of Shafts: Fatigue Failure in Rotating Components
Rotating shafts in mechanical systems — pump shafts, motor drive shafts, compressor crankshafts, gear shafts — are among the most common subjects of fractographic failure investigation. These components experience cyclic bending, torsional, and sometimes axial loading throughout their service life. Fatigue failure accounts for the large majority of unexpected shaft fractures encountered in industry.
Crack Initiation in Shafts
Fatigue cracks in shafts almost always initiate at the surface, because that is where bending stresses are highest (in bending-dominated loading) and where stress concentrations are located. The most common initiation sites include:
- Sharp fillet radii at diameter changes or shoulders
- Keyway corners — the intersection of the keyway end with the shaft surface is a severe stress concentrator
- Thread roots — particularly coarse threads and those with sharp root profile
- Press-fit bore edges — fretting wear and fretting fatigue at interference fits
- Machining marks and grinding burns — residual tensile stress and microstructural damage from grinding
- Corrosion pits — acting as geometric notches in corrosive environments
- Non-metallic inclusions at or near the surface — particularly in less-refined steels
Fatigue Crack Propagation and Beach Marks
Once initiated, a fatigue crack grows incrementally with each loading cycle. During stable Stage II propagation, the crack front advances by a mechanism of crack tip blunting (on loading) and resharpening (on unloading), leaving behind a pair of matched features on the mating fracture surfaces: striations. Each striation represents one fatigue cycle. Striation spacing increases as the crack grows, because the stress intensity at the crack tip increases with crack size, which in turn increases the crack extension per cycle.
At low magnification (stereo microscope or naked eye), the periodic arrest of the crack front during variations in loading amplitude creates beach marks (also called clamshell marks or arrest marks). These are visible as curved bands concentric with the initiation site. In rotating bending fatigue at low stress amplitude, a single initiation site produces a series of beach marks that form a semicircular or arc-shaped pattern expanding from the surface. Multiple initiation sites (indicating high applied stress or severe surface damage) produce overlapping, irregular beach mark patterns that meet in the overload zone.
Rotating Bending Fatigue: Identifying the Stress Level
The relationship between the size of the fatigue zone and the overload zone on a shaft fracture surface directly indicates the applied bending stress relative to the material’s strength:
| Fatigue Zone Size | Overload Zone Size | Implied Stress Level | Interpretation |
|---|---|---|---|
| Very large (>80% of cross-section) | Very small (<20%) | Low nominal stress | Long fatigue life; failure driven by stress concentration or material defect |
| Moderate (40-60%) | Moderate (40-60%) | Medium stress | Moderate fatigue life; typical HCF from vibration or misalignment |
| Small (<20%) | Large (>80%) | High nominal stress | Short fatigue life; LCF; possible overload contributing to crack initiation |
Role of Material Properties in Fatigue Performance
The intrinsic material properties of a shaft determine both its fatigue initiation resistance and its fatigue crack growth behaviour. Key properties include:
Fatigue Strength and Endurance Limit
For many steels, a stress amplitude exists below which fatigue failure does not occur within the classical definition of infinite life (10^7 cycles). This is the endurance limit (or fatigue limit), approximately 0.4 to 0.5 times the ultimate tensile strength (UTS) for carbon and alloy steels in bending. However, in corrosive environments this limit effectively disappears, and crack growth can occur at any cyclic stress amplitude above a threshold, which is why corrosion fatigue is so insidious in process plant shafts and pump components.
Fracture Toughness
Fracture toughness (K_Ic) governs the final fracture event: it determines the critical crack size at which unstable fracture occurs for a given applied stress. Higher toughness materials tolerate larger cracks before final failure, which is why high toughness is essential in fracture-critical applications. The UG-84 Charpy impact test requirements in ASME Section VIII serve as an indirect measure of fracture toughness, ensuring adequate toughness in pressure vessel shells and heads.
Microstructure and Heat Treatment
Microstructure profoundly affects fatigue behaviour. A fine, homogeneous martensitic or bainitic microstructure (from appropriate quench and temper heat treatment) provides better fatigue resistance than a coarse-grained, annealed structure. Decarburisation of the shaft surface during heat treatment reduces surface hardness and can dramatically reduce fatigue strength, because the softer surface decarburised layer has a lower endurance limit and is more prone to crack initiation. Fractographic evidence of decarburisation typically manifests as a rough, poorly defined initiation zone without a distinct geometric stress raiser.
Surface Condition and Residual Stress
Surface condition is the single most important design-level variable influencing fatigue initiation. Shot peening and surface rolling introduce beneficial compressive residual stresses at the surface, raising the effective fatigue limit. Grinding without adequate cooling, on the other hand, can introduce tensile residual stresses and temper the surface, both of which dramatically reduce fatigue life. Fractographic evidence of a grinding burn is often subtle — a slightly different colour band or a fracture origin at the surface without any visible geometric notch — and requires metallographic cross-section to confirm.
Common Fatigue Failure Modes in Shafts
Shaft fatigue encompasses several distinct failure modes, each with characteristic fractographic signatures that the analyst uses to distinguish them.
High Cycle Fatigue (HCF)
HCF occurs above approximately 10^5 cycles, typically under stress amplitudes well below the material yield strength. Fractographic features include fine, closely spaced beach marks, a large smooth fatigue zone occupying most of the cross-section, tightly spaced striations visible only at high SEM magnification (>5,000x), and a small final overload zone. HCF in shafts is most commonly caused by vibration, misalignment, or resonance — all of which produce stresses that individually seem low but accumulate over millions of cycles.
Low Cycle Fatigue (LCF)
LCF occurs below approximately 10^4 cycles at high stress amplitudes that approach or exceed the material yield strength. The fracture surface shows fewer, more widely spaced beach marks, widely spaced striations visible at moderate SEM magnification, significant surface deformation at the initiation site, and a large final overload zone relative to the fatigue zone. LCF in shafts is often caused by mechanical overload conditions, start-stop thermal cycling, or design errors that place excessive stresses on the shaft.
Fretting Fatigue
Fretting occurs at press-fit or splined interfaces where small-amplitude relative motion between mating surfaces causes surface damage, debris generation, and local stress concentration. Fretting fatigue crack initiation sites show characteristic red-brown iron oxide debris (fretting product), shallow surface pitting, and a rough, damaged initiation zone. The crack grows perpendicular to the fretting contact interface initially, then turns to propagate in the usual fatigue mode. Distinguishing fretting fatigue from plain bending fatigue directs corrective action toward interference fit design, surface coatings, or lubrication rather than simply redesigning the shaft geometry.
Corrosion Fatigue
When a shaft operates in a corrosive environment — water, brine, acid, or process fluids — the fatigue limit effectively disappears and crack initiation is assisted by pitting. Corrosion fatigue fracture surfaces are stained, often with oxide or scale deposits that obscure fine features. The initiation site is typically a corrosion pit at the surface rather than a geometric stress raiser. Corrosion fatigue is addressed through material upgrading (e.g., to stainless steels or duplex alloys — see the guide to duplex stainless steels), protective coatings, or environmental control.
Environmental and Operating Factors Affecting Fatigue Life
Operating environment has a profound and often underestimated influence on fatigue performance. Understanding environmental contributions to fatigue failure is essential for both root cause analysis and the design of corrective measures.
Temperature Effects
Elevated temperature reduces yield strength and fatigue strength, and promotes creep-fatigue interaction in high-temperature rotating components such as turbine shafts and compressor rotors. Low temperatures increase yield strength but reduce fracture toughness, promoting brittle fracture in the final overload stage and shifting the fracture mode from ductile dimple rupture to cleavage. The Charpy impact test requirements in pressure vessel codes address this directly by specifying minimum absorbed energy values at the lowest anticipated service temperature (MDMT).
Corrosive Media
Moisture, industrial atmospheres, and process fluids significantly reduce fatigue life by eliminating the fatigue limit and assisting crack initiation through pitting and surface dissolution. The fatigue crack growth rate (da/dN) in corrosive environments can be 10 to 100 times higher than in air at the same stress intensity range. Fractographic evidence of environmental damage includes: corrosion product deposits on the fracture surface, pitting at initiation sites, evidence of dissolution at the crack tip (rounded striation troughs rather than sharp), and secondary cracking along corrosion paths.
Surface Condition and Residual Stress
The surface finish has a direct effect on fatigue initiation life. Surface roughness introduces local stress concentrations proportional to the depth-to-radius ratio of machining marks. Deep scratches, tool marks, and grinding grooves act as initiation sites. Beneficial residual compressive stresses introduced by shot peening, surface rolling, or nitriding extend fatigue life by opposing the applied tensile stress at the surface, raising the effective stress needed to initiate a crack. Conversely, grinding burns, welding residual stresses, and EDM machining introduce tensile residual stresses that promote early crack initiation.
Fractographic Examination Techniques and Equipment
Macro-Scale Examination
The initial examination of a fracture surface begins at the macroscopic level with the naked eye and a hand lens. The analyst records the overall shape of the fracture, the location and appearance of any visually distinct zones, the presence of beach marks, shear lips, or chevron patterns, and the surface colour and texture. Oblique lighting is particularly effective at revealing surface topography and beach marks. Stereo light microscopes at magnifications from 5x to 40x provide the next level of detail without requiring any special surface preparation.
Micro-Scale Examination: SEM
The Scanning Electron Microscope (SEM) is the primary tool for micro-fractographic analysis. It provides three-dimensional topographic imaging of the fracture surface at magnifications from 50x to 50,000x or higher, with a depth of field far superior to optical microscopy. The SEM reveals striations, dimple morphology, cleavage facets, river marks, grain boundary features, and corrosion product deposits. The skill and experience of the SEM operator is critical: selecting the appropriate magnification, tilt angle, and secondary vs. backscattered electron detector mode determines the quality of the features revealed.
Energy Dispersive X-ray Spectroscopy (EDS/EDX)
EDS/EDX analysis, performed in conjunction with SEM, provides elemental composition data from selected points or areas on the fracture surface. This is valuable for identifying corrosion products (iron oxides, sulphides, chlorides), contaminants, inclusions at initiation sites, and surface coatings. EDS mapping can reveal the distribution of elements across the fracture surface, helping to distinguish between different types of corrosion or to confirm the presence of embrittling elements such as sulphur at grain boundaries.
Preservation and Documentation Protocol
Before any examination, fracture surfaces must be properly preserved. The following protocol minimises damage to the evidence:
- Photograph the fracture surface in situ before disturbing the component
- Separate mating fracture faces carefully, avoiding contact between them
- Wrap each face in clean lint-free tissue and store in dry, sealed containers with desiccant
- Do not clean, ultrasonically clean, or chemically treat the surface before initial examination
- If corrosion obscures features, gentle cleaning methods (compressed air, isopropanol rinse) may be used after initial documentation, never abrasive cleaning
- SEM samples may require gold or carbon coating if the material is non-conductive
Fractography in the Context of Welding and Pressure Equipment
Welded joints in pressure vessels, piping, and structures introduce a range of potential fracture origins that fractography can identify. Weld defects that act as fracture initiators include:
- Lack of fusion and lack of penetration: Planar defects that act as pre-existing cracks. On a fracture surface, unfused regions appear as smooth, flat areas without dimples or striations, often with an oxide film from the welding atmosphere.
- Weld porosity: Spherical voids that concentrate stress. Fracture through a pore shows a smooth spherical surface surrounded by dimple rupture or fatigue features depending on the loading mode.
- Hot cracks and solidification cracks: Intergranular fracture surfaces with a distinctive interdendritic morphology. See the WeldFabWorld guide on hot cracking in welds for the metallurgical context.
- Hydrogen-induced cold cracks: Transgranular or intergranular fracture with a characteristic stepped appearance, often with evidence of hydrogen blistering. Associated with high-strength steels and insufficient preheat — see the carbon equivalent calculator which is directly related to hydrogen cold cracking susceptibility.
- Weld toe fatigue: Initiated at the geometric notch of the weld toe, showing beach marks propagating from the weld surface into the base metal or HAZ.
For pressure vessel components, fracture toughness is assured through qualification testing (Charpy impact) as required by ASME Section VIII, while the welding procedure qualification under ASME Section IX ensures that the weld metal and HAZ meet the required mechanical properties. Delta ferrite content in austenitic stainless steel welds — discussed in the WeldFabWorld guide on delta ferrite importance — also relates to resistance to hot cracking, which fractography can confirm post-failure.
Recommended Books on Fractography and Failure Analysis
These texts are widely used by failure analysts, welding engineers, and materials specialists for deepening expertise in fractographic methods and related failure analysis practice.
Disclosure: WeldFabWorld participates in the Amazon Associates programme (StoreID: neha0fe8-21). If you purchase through these links, we may earn a small commission at no extra cost to you. This helps support free technical content on this site.