The cost of poor quality is the money a fabricator spends because work was not right the first time, including scrap, rework, weld repair, re-inspection, delay and customer claims. These costs rarely appear as one line in the accounts, so a shop can lose a large share of its margin without ever seeing the total.
The cost of poor quality (COPQ) in fabrication is the total cost of scrap, rework, weld repair, re-inspection, delay and claims caused by work that fails to meet requirements. Calculate it by adding internal failure costs and external failure costs for a set period, then express the total as a percentage of revenue. Use Pareto analysis to find the largest causes.
COPQ is a core metric in Six Sigma, and the guide to the Six Sigma concept, steps and examples explains the improvement method that usually follows the measurement. For fabricators, the ISO 3834 welding quality system supplies much of the prevention side, because it controls procedures, personnel, equipment and records before welding starts.
This guide defines the four categories of quality cost, shows how to cost a weld repair and sets out an eight-step method for calculating COPQ from shop data. It then gives a worked example for a mid-size pressure vessel shop, a Pareto analysis and a prevention return-on-investment case. All monetary figures are illustrative, so replace them with your own rates and costs.
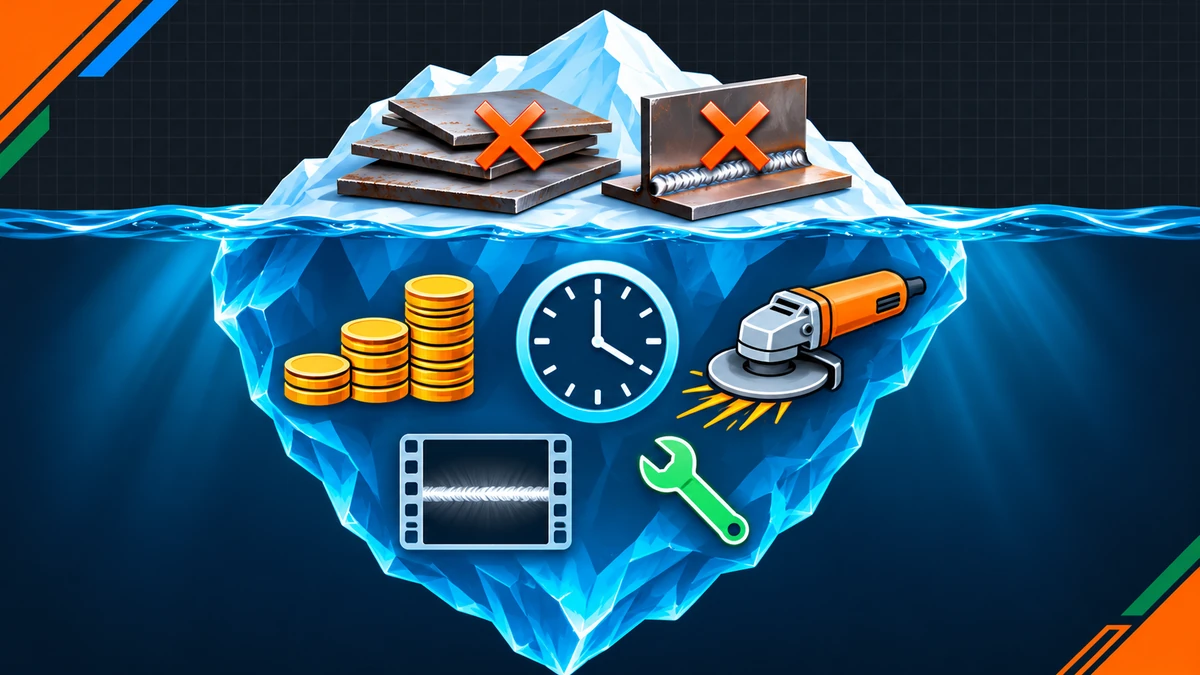
- COPQ is the cost of failure: internal failure (scrap, rework, repair, re-inspection) plus external failure (warranty, site rework, penalties, claims).
- Definitions vary, so state whether appraisal cost such as routine inspection is included in your COPQ figure and keep that definition fixed over time.
- A single rejected weld costs more than the repair labour, because re-examination, expanded sampling, schedule delay and lost capacity add to it.
- Expressing COPQ as a percentage of revenue or cost of goods sold lets you track trends and compare projects of different size.
- A Pareto analysis of failure costs by cause often shows that a few defect types account for most of the loss.
- Prevention spending on procedures, training, fit-up control and consumable handling is the main lever for lowering failure cost, and its return can be tested with a simple before-and-after calculation.
What Is the Cost of Poor Quality (COPQ) in Fabrication?
Cost of poor quality (COPQ) in fabrication is the total cost created when welded products, parts or documents fail to meet requirements the first time. It includes scrap, rework, weld repair, re-inspection, delay, warranty work and penalties, and it excludes the cost of work that was done right.
Cost of poor quality is a financial metric that totals all costs which would disappear if every product met requirements first time.
Welding is a special process: its quality cannot be fully verified by final inspection, so errors found late are expensive. A lack-of-fusion indication found by radiography after a long seam is finished needs gouging, re-welding and re-examination, and it may also need a repeat of heat treatment.
How Does COPQ Differ From the Cost of Quality?
The cost of quality (COQ) is all spending related to quality, good and bad. COPQ is the part of it that exists because of failure. Authors and companies differ on whether routine appraisal belongs in COPQ, so state your definition on every report.
| Term | Formula | Note |
|---|---|---|
| Cost of quality (COQ) | Prevention + appraisal + internal failure + external failure | Total quality-related spend, good and bad |
| Cost of good quality | Prevention + appraisal | Spend to achieve conformity |
| Cost of poor quality (COPQ) | Internal failure + external failure | Most common definition, used in this guide |
| COPQ including appraisal | Appraisal + internal failure + external failure | Used by some organisations, because routine inspection exists only because failures are possible |
What Are the Four Categories of Quality Cost?
Quality costs fall into four categories: prevention, appraisal, internal failure and external failure. This is the prevention, appraisal and failure (PAF) model, which is described in guidance such as BS 6143-2 from BSI and in the cost of quality resources of ASQ.
| Category | Meaning | Fabrication examples | In COPQ? |
|---|---|---|---|
| Prevention | Spend that stops defects occurring | WPS and PQR development, welder qualification and training, planning, ITP preparation, calibration, consumable storage control, supplier approval | No |
| Appraisal | Spend that finds defects | Incoming material checks, in-process inspection, NDT, hydrotest, third-party inspection, audits | Depends on definition |
| Internal failure | Failures found before delivery | Scrap, rework, weld repair, re-examination, re-heat treatment, re-coating, lost capacity, delay | Yes |
| External failure | Failures found after delivery | Site rework, warranty, replacement, liquidated damages, back-charges, complaint handling, loss of repeat business | Yes |
Appraisal is the category most often argued over. Inspection and testing are needed even in a good process, but the volume of NDT, hold points and third party inspection in welding rises when failures are frequent. The overview of non-destructive testing methods shows which examinations are normally treated as appraisal.
Why Is COPQ Often Underestimated?
COPQ is underestimated because most of it is booked in other accounts. Rework hours sit under production labour, extra NDT under inspection and delay under project overheads, so no single report shows the total.
- Lost capacity: welders, fitters and machines tied up in rework cannot produce saleable work.
- Schedule delay: late delivery can trigger liquidated damages, expediting costs and overtime.
- Expanded examination: when a weld in a random NDT sample is rejected, codes such as ASME B31.3 can require further welds to be examined, which multiplies appraisal cost.
- Re-qualification and retesting: a change made to cure a defect may need a new procedure test or welder test.
- Management time: engineers, inspectors and supervisors spend hours on NCRs, concessions and client meetings.
- Client confidence: audit findings and rejected deliveries reduce the chance of repeat orders, which is real but hard to price.
The iceberg in Figure 1 shows the pattern: scrap is visible, while most of the cost is submerged. The causes behind the visible part are listed in the guide to welding defects, types, causes and remedies.
Published COPQ percentages range from low single digits to well above 20 percent of sales, depending on the industry and on what is counted. They are rarely specific to fabrication. Measure your own figure and watch its trend instead of using a quoted benchmark.
How Much Does a Weld Repair Really Cost?
A weld repair costs the sum of defect removal, re-welding, consumables, re-examination and the overhead attached to the job. It is usually more than the repair labour alone suggests, and delay costs come on top.
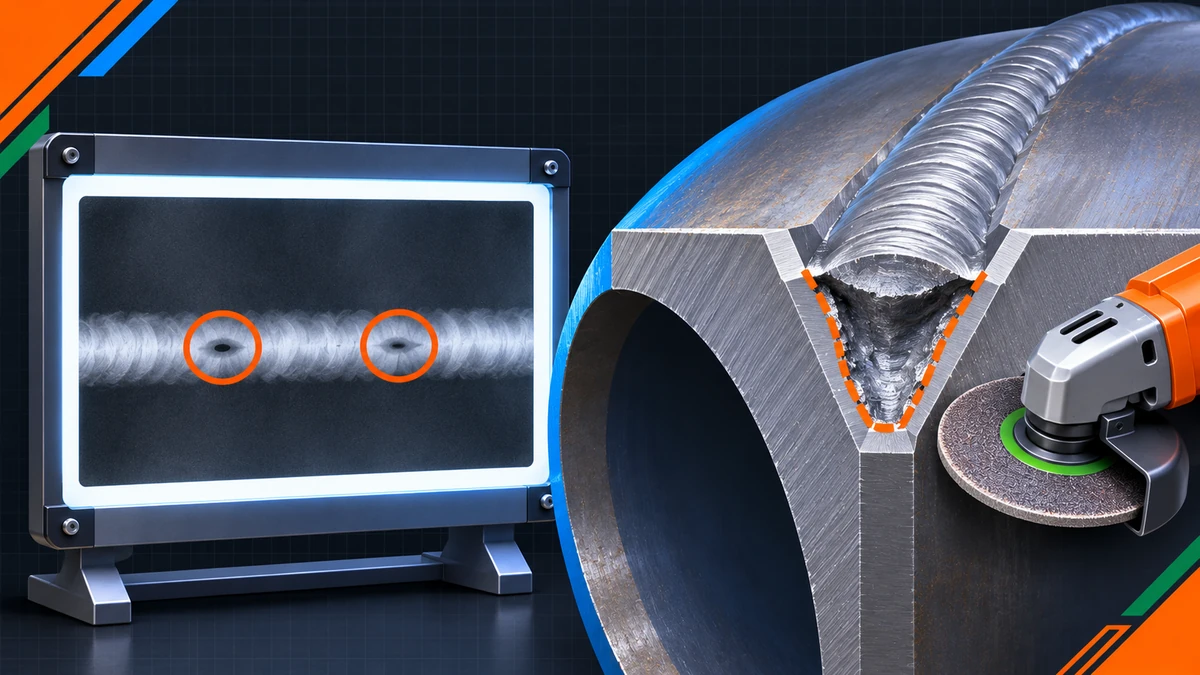
A typical repair sequence is to locate the defect, remove it by grinding or gouging, confirm removal by a surface method such as PT or MT, re-weld with a qualified repair procedure, and re-examine by the original method. Codes such as ASME Section VIII Division 1 allow repair of rejectable defects. The repaired area must meet the same acceptance criteria as the original weld, and many project specifications limit repeat repairs at the same location.
What Is the Difference Between Rework, Repair and Scrap?
ISO 9000 defines these as three different responses to a nonconforming product. In welding practice the word repair is also used for rework of a rejected weld, so confirm the meaning in your contract.
| Term | Meaning | Welding example |
|---|---|---|
| Rework | Action on a nonconforming product to make it conform to the requirements | Grinding out an undercut, re-welding and re-inspecting to the original acceptance criteria |
| Repair | Action on a nonconforming product to make it acceptable for the intended use | Restoring a part under an approved concession when it will not fully match the original specification |
| Scrap | Action on a nonconforming product to prevent its originally intended use | Cutting up and discarding a mis-fabricated spool |
What Is the Cost of One Weld Repair? (Worked Example)
The example uses stated, illustrative inputs: 14 labour hours at INR 650 per hour, INR 1,400 for consumables and gases, INR 3,500 for repeat radiography including film processing, and overhead for supervision and equipment at 25 % of labour.
Repair logs like this one provide the quantities for the rework line in the COPQ calculation that follows.
How Do You Calculate COPQ for a Fabrication Shop?
Calculate COPQ by booking every failure cost to a code, pricing it with agreed rates, adding it up for a fixed period and dividing by revenue. Eight steps turn scattered shop data into a figure that management can act on.
- Define the scope and period. Choose the company, project or product line and a period such as a month or the project duration, and print them on every report.
- Fix the definition. Decide whether COPQ means failure costs only or failure plus appraisal, and keep that choice for every report.
- Create cost codes. Add job-cost codes for scrap, rework, repair, re-examination, re-heat treatment, re-coating and site rework, so the cost is booked at source instead of reconstructed later.
- Collect the quantities. Take hours, materials and test counts from NCRs, repair logs, NDT reports and the welding documentation and record-keeping package.
- Price them. Apply labour rates, consumable costs, test charges and an overhead rate agreed with finance, and subtract any scrap resale value.
- Estimate hidden costs. Add delay, lost capacity and expediting using documented assumptions, and show them separately from booked costs.
- Total and normalise. Sum internal and external failure costs, then divide by revenue or cost of goods sold for the same period.
- Review and act. Present the result monthly with a Pareto chart of causes, and assign an owner to each major cause.
Finance should own the costing rules, and quality should own the cause data. The welding coordination function described in the article on welding coordinator roles and responsibilities usually knows the repair data best, so involve it from the start.
Worked Example: What Is the COPQ of a Mid-Size Pressure Vessel Shop?
A pressure vessel shop with annual revenue of INR 120,000,000 collects the costs in Table 4. The figures are illustrative and use the categories defined earlier.
| Cost line | Category | Amount (INR) |
|---|---|---|
| Training, qualification and procedure development | Prevention | 900,000 |
| Planning, calibration and preventive maintenance | Prevention | 700,000 |
| Inspection and NDT | Appraisal | 3,000,000 |
| Testing, audits and third-party inspection | Appraisal | 1,200,000 |
| Scrap and replaced material | Internal failure | 1,500,000 |
| Rework and weld repair, including re-examination | Internal failure | 4,100,000 |
| Re-heat treatment, re-coating and delay | Internal failure | 800,000 |
| Site rework and warranty | External failure | 1,300,000 |
| Penalties and complaint handling | External failure | 700,000 |
Failure costs are 59.2 % of total quality cost, while prevention is only 11.3 %. For every rupee spent on prevention, the shop loses INR 5.25 to failure. The same data changes by 3.5 percentage points depending on whether appraisal is counted, which is why the definition must be stated.
How Do You Find Where the Failure Money Is Going?
A Pareto analysis ranks failure causes by cost, so effort goes to the few causes that account for most of the loss. Table 5 splits the INR 6,400,000 of internal failure cost in the example by cause.
| Cause | Cost (INR) | Share | Cumulative |
|---|---|---|---|
| Lack of fusion repairs | 1,700,000 | 26.6 % | 26.6 % |
| Porosity (gas coverage, moisture, consumable handling) | 1,300,000 | 20.3 % | 46.9 % |
| Fit-up and distortion rework | 1,100,000 | 17.2 % | 64.1 % |
| Scrap from wrong material or cutting errors | 900,000 | 14.1 % | 78.1 % |
| Re-coating and surface preparation | 700,000 | 10.9 % | 89.1 % |
| Data-book correction and documentation | 700,000 | 10.9 % | 100.0 % |
The first three causes account for 64.1 % of internal failure cost, so a project aimed at weld fusion, gas coverage and fit-up would address most of the loss. Table 5 is only a view of the example data, and your own ranking will differ, so build the chart from your repair logs and NCRs.
How Do You Reduce COPQ in Fabrication?
Reduce COPQ by moving money from failure to prevention: qualify procedures and welders properly, control fit-up and consumables, check incoming material, plan inspection with hold points, and fix the causes found by root cause analysis. The aim is fewer defects, not more inspection.
| Lever | What it prevents | Metric to watch |
|---|---|---|
| Procedure and welder qualification | Lack of fusion and porosity from poor technique or out-of-range parameters | Repair rate by welder and process |
| Incoming material and consumable control | Wrong material, damp consumables, hydrogen-related cracking risk | Incoming rejection rate |
| Fit-up and distortion control | Misalignment, gap-related defects, dimensional rework | Dimensional rework hours |
| Inspection and test planning | Defects discovered late, missed hold points | Share of defects found at hold points |
| Workshop organisation | Mix-ups, damaged parts, search time | NCRs caused by handling |
| Root cause analysis and FMEA | Repeat defects | Repeat NCRs |
| Records and data-book control | Documentation rework and late client comments | Data-book rejections |
Several of these levers are covered in detail elsewhere on this site. The rules in incoming material checking rules stop wrong or damaged material at the gate, and welding consumable storage and handling addresses moisture-related porosity. A good inspection and test plan puts hold points where defects are cheapest to fix, and ASME IX welder qualification confirms that welders can produce sound welds in the positions they will use.
For systematic improvement, failure mode and effects analysis ranks risks before they become failures, and the 5S methodology in welding workshops reduces mix-ups and handling damage. Six Sigma projects use the DMAIC cycle to take a Pareto cause from measurement to control.
What Is the Return on Extra Prevention Spending?
Test any prevention proposal with a before-and-after calculation. The example below assumes that INR 1,000,000 of extra prevention spending, for welder skill testing and fit-up control, cuts internal failure cost by 25 %. The 25 % is an assumption, so confirm it after six to twelve months of data.
Which Metrics Should You Track Alongside COPQ?
Track a small set of metrics that explain why COPQ moves: repair rate, first pass yield, cost per NCR and the prevention-to-failure ratio. COPQ shows the financial effect, and these metrics show the process behaviour behind it.
| Metric | Formula | Example |
|---|---|---|
| Weld repair rate by length | Repaired weld length / examined weld length x 100 | 54 m / 1,200 m = 4.5 % |
| First pass yield | Units passing without rework or repair / units started x 100 | 954 / 1,000 = 95.4 % |
| COPQ as % of revenue | COPQ / revenue x 100 | 8,400,000 / 120,000,000 = 7.0 % |
| Cost per NCR | Failure cost / number of NCRs | 8,400,000 / 420 = 20,000 INR |
| Prevention-to-failure ratio | Prevention cost / failure cost | 1,600,000 / 8,400,000 = 0.19 |
Define each metric in writing before you report it. Repair rate, for example, can be counted by length, by number of welds or by number of films, and the three give different numbers.
Quick Reference: Where Does Each COPQ Cost Come From?
Each COPQ line has a usual data source and a usual owner. Use Table 8 to set up cost codes and to assign responsibility for each line.
| Cost line | Typical data source | Usual owner |
|---|---|---|
| Scrap and replaced material | Scrap notes, stores issue records, material traceability records | Stores and production |
| Weld repair labour | Repair log, traveller cards, timesheets | Production and welding coordination |
| Re-examination | NDT reports, NDT invoices | Quality control |
| Re-heat treatment and re-coating | PWHT charts, coating records | Production and coating supervisor |
| Delay and lost capacity | Schedule updates, machine and labour hours | Planning and project management |
| Site rework and warranty | Site reports, warranty log | Project and service teams |
| Penalties and back-charges | Contract notices, finance records | Commercial |
- Book failure cost at source with job codes instead of rebuilding it each quarter.
- Fix the definition and keep it for every report.
- Show booked costs and estimated hidden costs as separate lines.
- Review monthly and start improvement with the largest Pareto cause.
- Name one owner for each major cause.
What Are the Common Mistakes When Measuring COPQ?
Most COPQ errors come from what is left out or counted twice. A figure that only includes scrap usually understates the loss by a wide margin.
- Counting only scrap and ignoring rework hours, re-examination and delay.
- Having no cost codes, so rework disappears into normal production labour.
- Changing the definition between reports and then comparing the results.
- Counting repeat radiography in both appraisal and failure cost.
- Treating a rise in inspection volume as an improvement, when it may only be the cost of more failures.
- Copying benchmark percentages from other industries.
- Measuring COPQ without naming an owner or following up the largest cause.
Requirements depend on the code edition and contract specification applicable to your project, including repair limits, re-examination rules and delay clauses.
Are There Practical Notes for India and the Gulf Region?
Use your local currency and the labour and overhead rates approved by your finance team. In Indian and Gulf EPC contracts, delay damages, back-charges and client audit costs can be large, so read the contract clauses that govern them. Record third-party inspection hold time when it results from rework, because it is a real cost of failure.
Key Terms
- Cost of quality (COQ)
- The total of prevention, appraisal, internal failure and external failure costs.
- Cost of poor quality (COPQ)
- The cost of failure, normally internal failure plus external failure costs.
- Prevention cost
- Spending on planning, training, procedures and controls that stop defects occurring.
- Appraisal cost
- Spending on inspection, testing and audits that find defects.
- Internal failure cost
- The cost of defects found before the product reaches the customer.
- External failure cost
- The cost of defects found after delivery, including warranty and penalties.
- First pass yield
- The share of units that pass without rework or repair.
- Pareto analysis
- A ranking of causes by cost or frequency to show which few account for most of the loss.
Frequently Asked Questions About COPQ
What is a good COPQ percentage for a fabrication shop?
There is no universal target, because the percentage depends on what is counted, the products made and the contract terms. Published figures range widely and are rarely specific to fabrication. A more useful goal is a falling trend measured with the same definition each month. Compare projects within your own company before comparing with other firms.
Is appraisal cost part of COPQ?
It depends on the definition. The most common definition counts only internal and external failure costs and treats prevention and appraisal as the cost of good quality. Some organisations include appraisal because routine inspection is needed only when failures are possible. Choose one definition, state it on every report, and do not change it between periods.
How do you calculate the cost of rework in welding?
Multiply the repair labour hours by the agreed labour rate, then add overhead, consumables and gases, and re-examination costs such as repeat radiography. Take the hours from repair logs, traveller cards and NCRs rather than estimating them. Add repeated heat treatment or re-coating when they occur. Show delay and lost capacity separately, because they are estimates.
What is the difference between COPQ and the cost of quality?
The cost of quality is the total of prevention, appraisal, internal failure and external failure costs. COPQ is the part caused by failure, normally internal plus external failure costs. The remaining part, prevention and appraisal, is the cost of good quality. Both are usually expressed as a percentage of revenue or cost of goods sold.
How does Six Sigma use COPQ?
Six Sigma projects use COPQ to size a problem, decide which project to start and show the financial result after improvement. The measurement is followed by Pareto analysis and the DMAIC cycle to remove the largest causes. In a fabrication shop, a typical target is a defect type such as lack of fusion or porosity that dominates the repair log. The project then tracks repair rate and COPQ until the gain is stable.
How does ISO 3834 help reduce COPQ?
ISO 3834 requires documented control of requirements review, welding personnel, equipment, consumables, inspection and records at the quality level chosen. These are prevention activities, so they reduce the failures that make up COPQ. The standard does not guarantee a lower COPQ by itself, because the controls must be applied on the shop floor. Track repair rate before and after implementation to see the effect.
Which inspection checks catch problems earliest?
Pre-weld checks of documents, material identification, fit-up, cleanliness and preheat catch problems before any welding cost is spent. The welding inspection checklist covers pre-weld, in-process and post-weld checks. A defect found at fit-up costs less to fix than the same defect found after final NDT. Place hold points accordingly.
Conclusion
The cost of poor quality turns scattered scrap, rework, repair and claim records into one number that management can act on. Book failure costs to codes at source, state whether appraisal is included, and express the result as a percentage of revenue. In the worked example, failure cost was 7.0 % of revenue and 5.25 times the prevention spend, and a Pareto chart showed that three causes made up 64 % of internal failure cost. Start the same analysis with your own repair logs, then fund prevention where the data point. As a next step, work through the largest cause using the method in the guide to root cause analysis for weld failures.
Standards and References
- ISO 9000, Quality management systems – Fundamentals and vocabulary (ISO)
- ISO 9001, Quality management systems – Requirements (ISO)
- ISO 10014, Quality management – Guidelines for realizing financial and economic benefits (ISO; confirm the current edition)
- BS 6143-2, Guide to the economics of quality – Prevention, appraisal and failure model (BSI)
- ISO 3834-1, ISO 3834-2, ISO 3834-3 and ISO 3834-4, Quality requirements for fusion welding of metallic materials (ISO)
- ISO 14731, Welding coordination – Tasks and responsibilities (ISO)
- ASME Boiler and Pressure Vessel Code, Section VIII, Division 1, Rules for Construction of Pressure Vessels (ASME)
- ASME B31.3, Process Piping (ASME)
Requirements depend on the code edition and contract specification applicable to your project. General quality standards are available from ISO.
This guide was prepared by the WeldFabWorld technical team from the standards listed under Standards and References. Verify every requirement against the code edition and specification that apply to your project.
Related Guides on WeldFabWorld
More guides on welding quality systems are collected in the Quality & Management category.