TTT vs CCT Diagrams: Practical Differences for Welders
TTT and CCT diagrams are often introduced together, and it is easy to come away thinking they are interchangeable tools that both describe how austenite transforms on cooling. In practice, they answer different questions under different conditions, and reaching for the wrong one is a genuine, recurring source of error in weld HAZ microstructure prediction. This guide sets the fundamentals aside and focuses squarely on the practical question a welding engineer actually needs answered: which diagram applies to which situation, and what goes wrong when the distinction is ignored.
If you need the underlying explanation of what a TTT diagram or CCT diagram is, how the C-curve shape arises, and how ferrite, pearlite, bainite, and martensite form, that ground is covered thoroughly in the related guides linked throughout this article. Here, the focus stays on decision-making: when each diagram is the right tool, how they relate to one another quantitatively, and the specific mistakes that come from mixing them up.
This article assumes familiarity with the basic C-curve concept and builds directly on it. For the fundamentals, see martensite, bainite & pearlite: cooling rate effects, the iron-carbon phase diagram guide, and steel microstructure: ferrite, pearlite & martensite. This article does not re-derive those fundamentals; it addresses the practical TTT-versus-CCT decision directly.
The One-Line Difference That Actually Matters
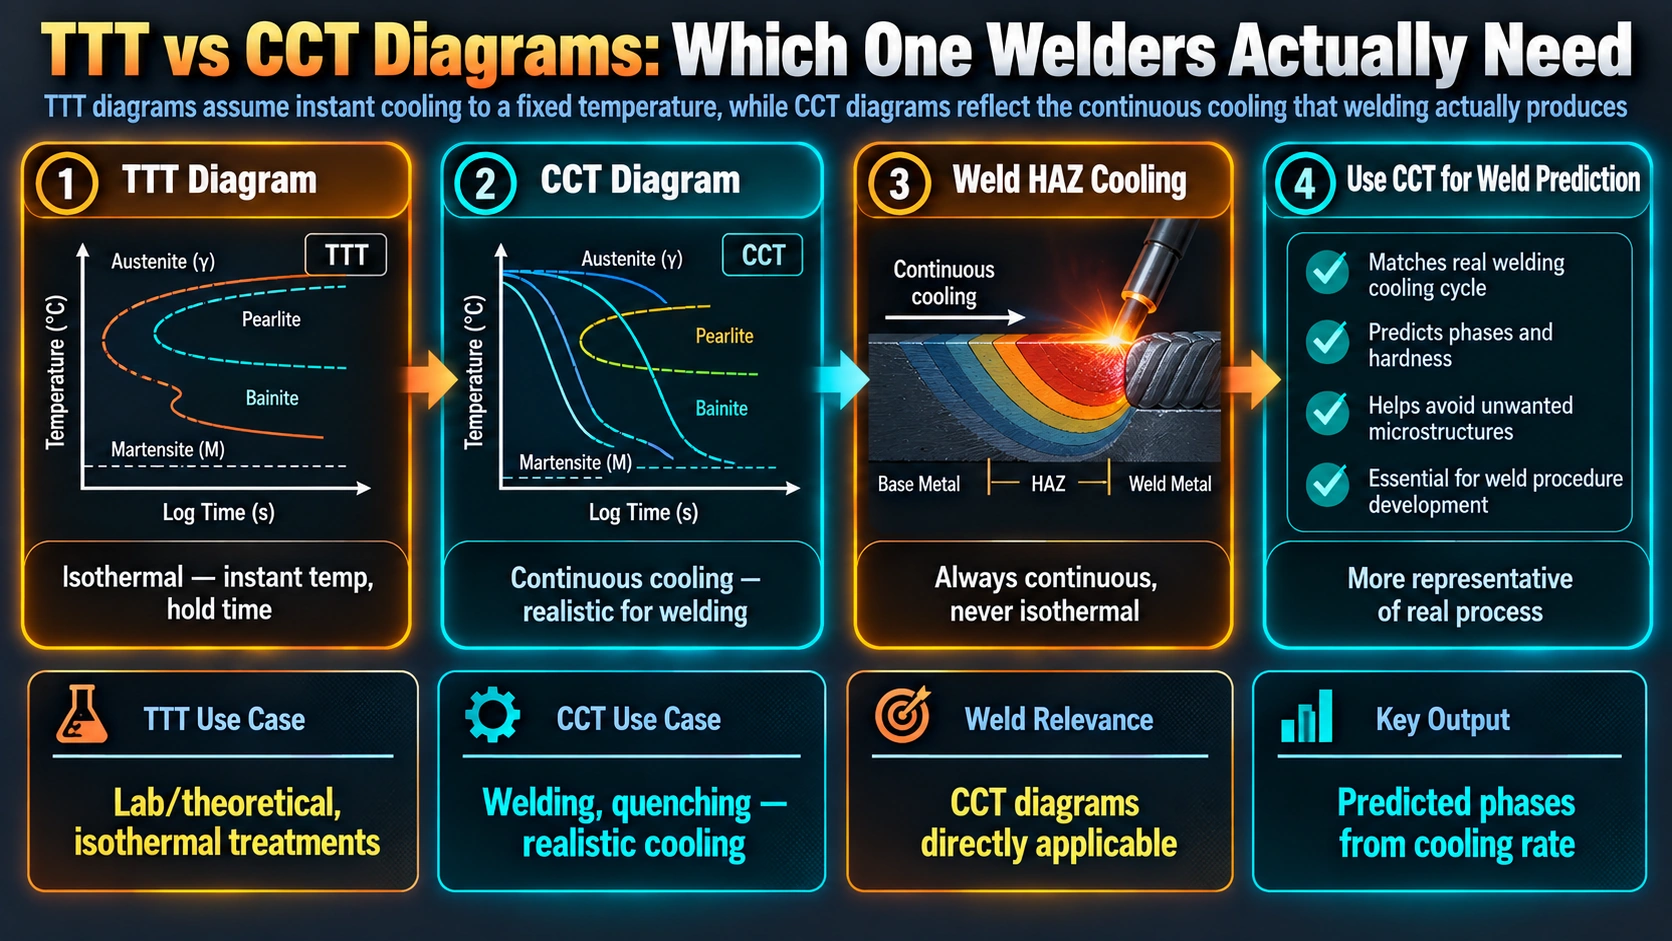
A TTT diagram describes austenite quenched rapidly to a fixed temperature and then held there indefinitely, accumulating time at that single constant temperature until transformation begins and completes. A CCT diagram describes austenite cooled continuously, without any hold, passing through the entire transformation temperature range on a falling temperature-time path. Welding, preheating, quenching, and almost every other fabrication thermal cycle a welding engineer deals with is a continuous cooling process. This single distinction is the reason CCT diagrams, not TTT diagrams, are the correct tool for predicting weld heat-affected zone microstructure, and it is worth stating plainly because the two diagram types look superficially similar and are frequently confused in practice.
Why a TTT Diagram Cannot Be Read Directly for Weld HAZ Prediction
The C-curve on a TTT diagram represents the incubation time required for transformation to begin at each constant temperature. A continuously cooling weld HAZ never spends that full incubation time at any single temperature; it passes through each temperature only briefly on its way to the next, lower one. If a welding engineer were to read a TTT diagram directly and conclude that, because the cooling path passes near the TTT nose temperature quickly, the steel has “enough time” to start transforming to pearlite at that point, the prediction would be wrong, and wrong in the dangerous direction: it would overestimate how much softer, more ferrite/pearlite-rich structure forms, understating the likelihood that martensite actually forms in the HAZ.
Using TTT-based transformation start times to justify a lower preheat or a higher heat input than a CCT-based assessment would allow is a real and consequential error. It systematically understates the risk of hard, crack-susceptible martensite forming in the HAZ, because TTT incubation times are always longer, at any given temperature, than the effective time available during continuous cooling through that same temperature.
How the CCT Curve Is Shifted Relative to the TTT Curve
For the same steel composition and prior austenite condition, the CCT curve’s pearlite and bainite start regions sit at longer times and somewhat lower temperatures than the corresponding TTT nose. This shift has a direct physical explanation: during continuous cooling, the material only spends a brief, ever-decreasing amount of time at any single temperature as it falls toward the next one, accumulating less effective nucleation time at each temperature than an isothermal hold would provide at that same temperature. The net effect is that transformation is delayed, in terms of the overall time elapsed, compared with where the TTT nose alone would suggest, and the transformation that eventually does occur happens at a somewhat lower temperature than the TTT nose temperature.
Practical Decision Table: Which Diagram for Which Task
| Task | Correct diagram | Why |
|---|---|---|
| Predicting weld HAZ microstructure from a known cooling rate or t8/5 | CCT | Welding is a continuous cooling process, not an isothermal hold |
| Selecting preheat or interpass to avoid excessive HAZ martensite | CCT | Directly maps cooling rate to resulting microstructure |
| Determining the critical cooling rate for full martensite | CCT | Critical cooling rate is a continuous-cooling concept by definition |
| Designing austempering or martempering (isothermal hold) | TTT | These processes are deliberately isothermal by design |
| Estimating incubation time before pearlite starts at a fixed stress-relief hold temperature | TTT | The process genuinely holds at constant temperature |
| Building intuition for why the C-curve nose exists | Either | Both diagrams share the same underlying transformation kinetics |
Reading a CCT Diagram for a Welding Decision
In practice, a CCT diagram is used by overlaying the expected cooling curve for a given welding condition onto the diagram and observing which transformation region, or regions, that curve passes through on its way down to room temperature. The cooling curve is most commonly characterised in welding by the t8/5 cooling time, the time taken to cool from 800 to 500 degC through the critical transformation range, which is directly controlled by heat input, preheat, interpass temperature, joint geometry, and plate thickness.
Both higher preheat and higher heat input slow the cooling rate, which shifts the effective cooling curve to the right on the CCT diagram, moving it away from the martensite region and toward bainite or ferrite-pearlite. This is the physical basis for using preheat to control HAZ hardness and reduce hydrogen cracking risk. See the carbon equivalent guide for how base metal chemistry, which determines the position of the C-curve itself, factors into preheat selection, and the Jominy end quench test guide for the physical hardenability measurement that underlies where the CCT nose sits for a given steel.
Common Misreadings and Practical Pitfalls
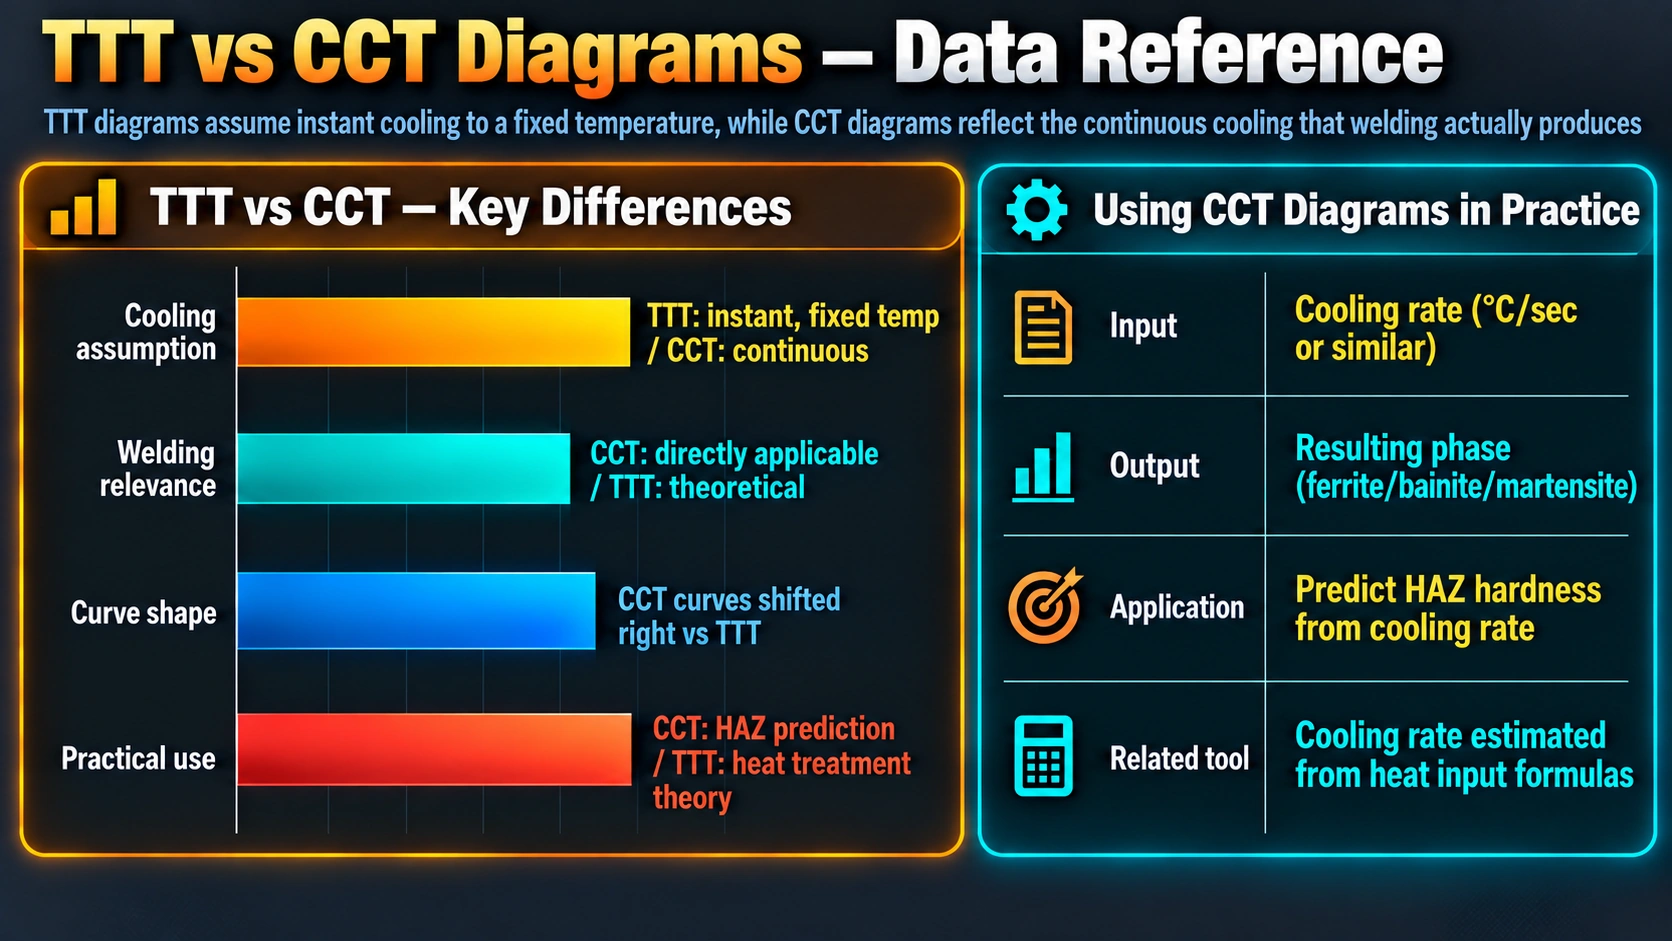
Reading transformation start times off a TTT diagram for a continuously cooling weld
As explained above, this systematically understates martensite risk by overestimating the effective time available for diffusional transformation. If only a TTT diagram is available for a given steel, it can inform qualitative expectations about hardenability tendency, but it should not be used to read quantitative transformation start times for a continuous-cooling welding scenario.
Assuming a handbook CCT diagram applies unchanged to a specific weld
Published CCT diagrams are specific to the prior austenite grain size and austenitising condition used to generate the data, both of which shift curve position. A weld HAZ austenitises extremely rapidly, near the fusion line reaching a much coarser prior austenite grain size than typical wrought material, which generally shifts the C-curve to longer times, increasing hardenability locally compared with the base metal’s bulk CCT diagram. Treat published diagrams as a strong qualitative guide, not an exact prediction, for any specific weld.
Assuming weld metal follows the same diagram as the equivalent wrought base metal
Weld metal has a different as-solidified grain structure and can carry compositional segregation from solidification that a bulk CCT diagram, built on homogeneous wrought material, does not capture. See the segregation in weld metal guide for how this local compositional variation can shift transformation behaviour at the microscale, in ways a single nominal CCT diagram cannot represent.
Practical Engineering Notes
When a base metal supplier or reference text provides only a TTT diagram for a given steel, treat it as background context on hardenability tendency, not as the basis for a HAZ hardness or preheat decision. Where a genuine welding decision is being made, insist on CCT data, or fall back on carbon equivalent and known heat input/t8/5 relationships, which are built specifically around continuous cooling behaviour.
Frequently Asked Questions
What is the single most important practical difference between TTT and CCT diagrams?
A TTT diagram describes what happens when austenite is cooled rapidly to a fixed temperature and then held there indefinitely, while a CCT diagram describes what happens when austenite is cooled continuously, without any hold, from the austenitising temperature down through the transformation range. Welding, preheating, and virtually every other fabrication cooling scenario are continuous cooling processes, not isothermal holds, which is why CCT diagrams, not TTT diagrams, are the correct tool for predicting weld heat-affected zone microstructure.
Why can’t a TTT diagram be used directly to predict weld HAZ microstructure?
A TTT diagram assumes the material spends time sitting at one constant temperature, accumulating incubation time toward transformation at that single temperature. A cooling weld HAZ never does this; it passes continuously through a whole range of temperatures, spending only a brief, ever-changing amount of time at each one. Reading transformation start times directly off a TTT diagram would significantly overestimate how much time is available for diffusional transformation to begin, understating the likelihood that martensite forms.
How does a CCT curve differ in position from the TTT curve for the same steel?
For the same steel, the CCT curve’s pearlite and bainite start regions are shifted to longer times and somewhat lower temperatures compared with the TTT curve’s nose. During continuous cooling, the material passes through each temperature only briefly on its way to a lower one, accumulating less effective incubation time at any single temperature than an isothermal hold would provide, so transformation is delayed relative to where the TTT nose would suggest.
When should a welding engineer actually use a TTT diagram?
TTT diagrams remain the correct tool for genuinely isothermal heat treatment processes, such as austempering, martempering, or an isothermal spheroidising anneal, where the steel is deliberately quenched to and held at a fixed intermediate temperature to allow a specific transformation to occur under constant-temperature conditions. They are also useful for understanding incubation time concepts and the underlying C-curve shape that CCT behaviour is derived from.
Can a CCT diagram from a handbook be applied directly to any heat of the same steel grade?
Not without caution. Published CCT diagrams are specific not only to nominal composition but also to prior austenite grain size and the austenitising condition used to generate the data, both of which shift the curve position. A weld HAZ austenitises very rapidly to a grain size that can differ substantially from the wrought or cast condition used to generate a handbook CCT diagram, so published curves should be treated as a useful guide rather than an exact prediction for a specific weld.
What is the critical cooling rate and how is it read from a CCT diagram?
The critical cooling rate is the slowest continuous cooling rate that still avoids the pearlite and bainite transformation regions entirely, producing a fully martensitic structure. On a CCT diagram, it is identified as the cooling curve that just clears the nose of the pearlite/bainite C-curve without touching it. Steels with higher hardenability have their C-curve nose pushed further to the right, meaning a slower cooling rate is sufficient to achieve full martensite, the same property measured directly by the Jominy end quench test.
How do CCT diagrams connect to preheat and heat input decisions in welding?
Preheat and heat input both act on the same variable a CCT diagram plots against transformation: the cooling rate, most commonly expressed in welding as the t8/5 cooling time, the time taken to cool from 800 to 500 degC. Higher preheat and higher heat input both slow the cooling rate, shifting the effective cooling curve to the right on the CCT diagram, away from the martensite region and toward bainite or ferrite-pearlite, which is the physical basis for using preheat to control HAZ hardness.
Does weld metal follow the same CCT diagram as the equivalent wrought base metal?
Not exactly. Weld metal has a different as-solidified grain structure, often coarser and more segregated than wrought base metal, and can carry compositional segregation from solidification that a bulk CCT diagram, built on homogeneous wrought material, does not capture. CCT diagrams for base metal remain a useful reference for weld metal transformation tendency, but segregation effects mean some local variation from the nominal diagram should be expected.
Recommended Reading
Welding Metallurgy and Weldability
Graduate-level reference covering CCT diagram application to HAZ microstructure prediction across a wide range of steel grades.
View on AmazonPrinciples of Heat Treatment of Steel
Core metallurgy text on transformation kinetics, TTT and CCT diagram construction, and the physical basis for their differences.
View on AmazonSteels: Microstructure and Properties
Detailed reference on phase transformation diagrams, hardenability, and their engineering application.
View on AmazonASM Handbook — Heat Treating, Volume 4
Comprehensive industrial reference including published TTT and CCT diagrams for common steel grades.
View on AmazonDisclosure: WeldFabWorld participates in the Amazon Associates programme (StoreID: neha0fe8-21). If you purchase through these links, we may earn a small commission at no extra cost to you. This helps support free technical content on this site.