Tempering Curves and Their Use in Heat Treatment
A tempering curve is the engineering tool that turns the general idea of tempering, reheating quenched steel to trade some hardness for toughness, into a specific, usable number: exactly how much hardness a given steel loses at each tempering temperature. Where a general discussion of heat treatment explains why tempering is done, a tempering curve tells an engineer precisely what temperature and time combination will deliver the hardness, strength, or toughness a specification requires for that exact alloy.
This matters directly to welding engineers working with quenched and tempered steels, because post-weld heat treatment is, metallurgically, just another tempering cycle applied to the base metal alongside the HAZ. Get the PWHT temperature wrong relative to the base metal’s original tempering curve, and the result is either inadequate HAZ tempering or unintended over-softening of material that was already correctly heat treated. This guide explains what a tempering curve shows, why it takes the shape it does, and how it is used in practice to set safe PWHT parameters.
This article focuses specifically on the hardness-versus-tempering-temperature curve as an engineering selection tool. For the general mechanism and purpose of tempering within the broader heat treatment sequence, see annealing, normalizing, quenching and tempering. For the related toughness-based transition curve used to assess long-term temper embrittlement, see temper embrittlement.
What Is a Tempering Curve?
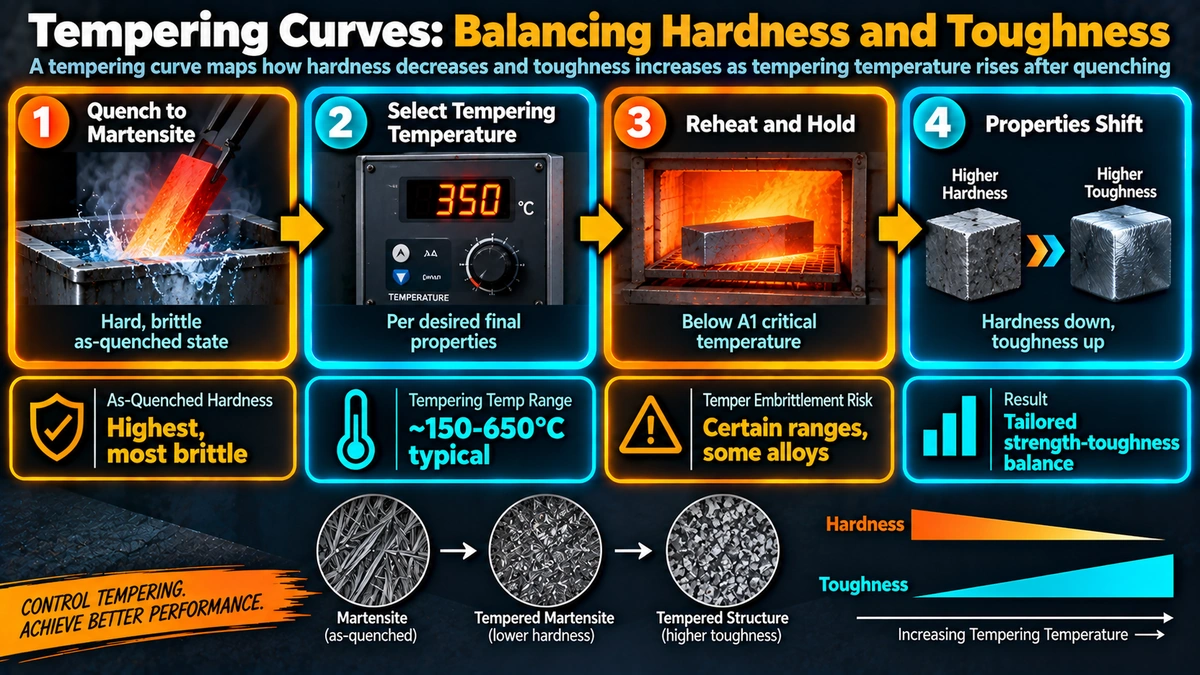
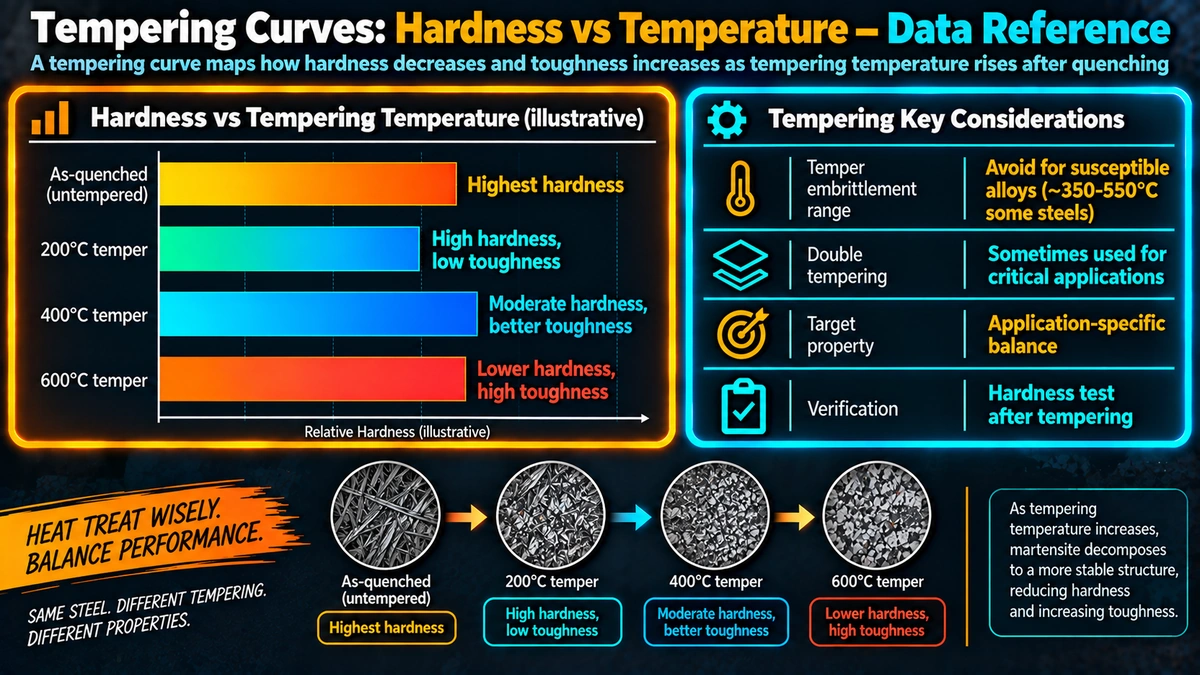
A tempering curve is a plot of hardness, and sometimes strength or impact toughness, on the vertical axis against tempering temperature on the horizontal axis, for a given steel held at a fixed tempering time, typically one to two hours, at each point tested. It is built experimentally: a batch of identically quenched specimens of the same steel is tempered at a series of increasing temperatures, one specimen per temperature, and the resulting hardness of each is measured and plotted. The result is a direct, empirical picture of how a specific alloy responds to tempering across the full practical temperature range, rather than a generic statement that “tempering reduces hardness.”
Why Tempering Curves Generally Slope Downward
As tempering temperature rises, carbon trapped in the highly distorted as-quenched martensite lattice becomes progressively more mobile and precipitates as carbide particles, relieving the lattice strain responsible for as-quenched hardness. At low tempering temperatures the precipitated carbides are extremely fine and closely spaced, still providing significant resistance to dislocation movement; as temperature increases further, these carbides coarsen and become more widely spaced, offering progressively less resistance. This is why hardness and strength fall, while ductility and toughness generally rise, as tempering temperature increases across most of the practical range, the basic trade-off that makes tempering temperature the primary lever for setting final mechanical properties in quenched and tempered steel.
The Stages of Tempering and Their Signature on the Curve
Stage 1 — Epsilon carbide precipitation (roughly 100 to 200 degC)
The first fine transition carbides precipitate from the supersaturated martensite, producing a small, sometimes barely perceptible initial hardness change as internal stress begins to relieve.
Stage 2 — Retained austenite decomposition (roughly 200 to 300 degC)
Any austenite retained from the original quench, particularly in higher carbon and more highly alloyed steels, decomposes to bainitic ferrite and carbide in this range, which can produce a slight, alloy-dependent change in the slope of the curve.
Stage 3 — Cementite formation and coarsening (roughly 250 to 700 degC)
Epsilon carbide is progressively replaced by cementite, which then coarsens steadily with increasing temperature. This is the dominant stage across most of the practical tempering range and is responsible for the general downward slope seen on most tempering curves.
Secondary hardening hump (roughly 500 to 600 degC, alloy-dependent)
In steels containing strong carbide-forming elements, particularly chromium, molybdenum, and vanadium, a distinct local rise in hardness interrupts the general downward trend in this temperature range. Very fine, coherent alloy carbides (such as Mo2C, VC, and Cr-rich carbides) precipitate and are, for a time, more effective barriers to dislocation movement than the coarser cementite present at that stage, temporarily raising hardness before it resumes falling at still higher temperature as these alloy carbides also coarsen. This secondary hardening hump is a defining feature of Cr-Mo-V hot-work tool steels and is also visible, to a lesser degree, in some creep-resistant Cr-Mo pressure vessel steels.
Some low alloy steels tempered or slow-cooled through roughly 350 to 575 degC show reduced impact toughness without a corresponding change in hardness, caused by phosphorus, tin, and antimony segregating to prior austenite grain boundaries. Because this effect appears on a toughness-versus-temperature curve rather than the hardness-versus-temperature curve discussed here, it is a related but distinct phenomenon. See the temper embrittlement guide for the Charpy transition curve approach used to assess it.
Time-Temperature Equivalence: The Hollomon-Jaffe Parameter
A tempering curve is normally built at one fixed hold time, but in practice, engineers often need to know whether a shorter, hotter cycle will produce a result equivalent to a longer, cooler one, for example when a code allows a range of acceptable PWHT time-temperature combinations. The Hollomon-Jaffe tempering parameter provides this equivalence.
Practical Use: Matching PWHT to the Base Metal’s Tempering Curve
For quenched and tempered steels, such as the grades discussed in the 4140/4340 alloy steel welding guide, the base metal’s mechanical properties were established by tempering at a specific, certified temperature after quenching. Post-weld heat treatment applied to the completed weldment reheats not just the HAZ but the entire base metal, effectively adding a second tempering cycle on top of the original one.
PWHT temperature on a quenched and tempered steel must stay below the original tempering temperature certified for that heat of material. If PWHT is performed at or above the original tempering temperature, the base metal is driven further down its own tempering curve, reducing hardness and strength below the certified, specified level, not just in the HAZ but throughout the affected base metal.
In practice, this means the original tempering temperature of a Q&T base metal is essential information before PWHT parameters can be finalised, and welding procedure specifications for these steels typically state a maximum PWHT temperature with an explicit margin below the certified original tempering temperature. See the PWHT soak time calculator for how code-minimum hold times are determined once an acceptable temperature has been established, and the heat treatments in welding guide for the broader quenching and tempering sequence this fits into.
Reading Tempering Curve Shape by Steel Type
| Steel type | Typical curve shape | Practical note |
|---|---|---|
| Plain carbon steel | Smooth, continuous decline | No secondary hardening; straightforward temperature selection |
| Low alloy Q&T steel (e.g. 4140, 4340) | Smooth decline, gentler slope than plain carbon | Original temper temperature must be known before PWHT is set |
| Cr-Mo creep-resistant steel (e.g. P91, P22) | Decline with a modest secondary hardening tendency | PWHT window is code-defined and relatively narrow — see P91 guide |
| Cr-Mo-V hot-work tool steel | Pronounced secondary hardening hump around 500-600 degC | Tempering temperature is deliberately chosen at or near the hump for peak properties |
Practical Engineering Notes
Before finalising a PWHT cycle on a quenched and tempered or precipitation-hardening alloy steel, confirm the original tempering temperature from the material’s mill certificate or heat treatment record, and build in an explicit margin below it. Where the base metal is a Cr-Mo-V or similar secondary-hardening grade, also check whether the proposed PWHT temperature falls near that alloy’s secondary hardening range, since a small temperature shift in that zone can move hardness in an unexpected direction compared with a simple steel.
Frequently Asked Questions
What is a tempering curve?
A tempering curve is a plot of hardness, or sometimes strength, against tempering temperature for a given quenched steel held at a fixed time, typically one or two hours, at each temperature. It is built by tempering a series of identically quenched specimens at increasing temperatures and measuring the resulting hardness of each, giving a direct, empirical picture of how much a given steel softens as tempering temperature increases, and revealing any temperature ranges where softening pauses or reverses.
Why do tempering curves generally slope downward?
As tempering temperature increases, carbon trapped in the distorted as-quenched martensite lattice becomes progressively more mobile, precipitating out as increasingly coarse carbide particles and relieving lattice strain. Coarser, more widely spaced carbides provide less resistance to dislocation movement than the fine, highly strained as-quenched structure, so hardness and strength fall as tempering temperature rises, while ductility and toughness generally improve, which is the basic trade-off tempering is used to control.
What is the secondary hardening hump on a tempering curve?
The secondary hardening hump is a local rise in hardness, interrupting the otherwise downward trend of the tempering curve, seen in steels alloyed with strong carbide-forming elements such as chromium, molybdenum, and vanadium, typically in the 500 to 600 degC range. It occurs because these alloying elements form very fine, coherent alloy carbides at this temperature range, more effective at blocking dislocation movement than the coarser cementite present at that stage, temporarily increasing hardness before it falls again at higher tempering temperatures.
What is the temper embrittlement trough seen on some tempering curves?
Some low alloy steels tempered or slow-cooled through roughly 350 to 575 degC show a drop in impact toughness without a corresponding drop in hardness, caused by segregation of impurity elements such as phosphorus, tin, and antimony to prior austenite grain boundaries. Because this shows up on a toughness-versus-temperature curve rather than the hardness-versus-temperature curve, it is a related but separate phenomenon; the mechanism and testing approach are covered in the temper embrittlement guide.
What is the Hollomon-Jaffe tempering parameter?
The Hollomon-Jaffe parameter combines tempering temperature and time into a single value, allowing different time-temperature combinations that produce approximately equivalent tempering results to be compared directly. It is expressed as P equals T multiplied by the quantity C plus the logarithm of t, where T is absolute temperature, t is time, and C is a material-dependent constant, typically around 15 to 20 for steel. This is the theoretical basis for selecting a shorter, hotter PWHT cycle or a longer, cooler one to achieve an equivalent tempering effect, within code-permitted limits.
Why must PWHT temperature stay below the original tempering temperature of a Q&T steel?
If post-weld heat treatment is performed at or above the temperature originally used to temper a quenched and tempered base metal, the PWHT cycle will over-temper the base metal, driving its hardness and strength down the tempering curve below the level guaranteed by the original heat treatment and potentially below the minimum specified mechanical properties. Welding procedures for Q&T steels therefore specify a maximum PWHT temperature safely below the certified original tempering temperature.
How are tempering curves used in practice by welding engineers?
Welding engineers use tempering curves, or the underlying time-temperature parameter relationships, to select a PWHT temperature and hold time that will produce HAZ properties consistent with the rest of a quenched and tempered component, to confirm a proposed PWHT cycle will not over-temper the base metal below its specified minimum properties, and to anticipate whether a given alloy steel is likely to show a secondary hardening hump or a temper embrittlement range that should be avoided during procedure qualification.
Do all steels show the same tempering curve shape?
No. Plain carbon and low alloy steels without strong carbide-forming additions generally show a smooth, continuously downward-sloping tempering curve. Steels alloyed with chromium, molybdenum, and vanadium, including many creep-resistant pressure vessel steels and hot-work tool steels, commonly show a secondary hardening hump around 500 to 600 degC. The specific shape and softening rate depend on the alloy content and must be established experimentally or taken from published data for the specific grade.
Recommended Reading
Steels: Microstructure and Properties
Core metallurgy reference covering martensite tempering stages, secondary hardening, and property-processing relationships.
View on AmazonPrinciples of Heat Treatment of Steel
Detailed text on quenching, tempering kinetics, and the Hollomon-Jaffe and related time-temperature parameters.
View on AmazonWelding Metallurgy and Weldability
Graduate-level reference connecting PWHT thermal cycles and base metal tempering behaviour to weldability.
View on AmazonASM Handbook — Heat Treating, Volume 4
Comprehensive industrial reference on tempering practice, including secondary hardening and alloy-specific tempering curve data.
View on AmazonDisclosure: WeldFabWorld participates in the Amazon Associates programme (StoreID: neha0fe8-21). If you purchase through these links, we may earn a small commission at no extra cost to you. This helps support free technical content on this site.